
You are here:
Sales Analytics Leaderboard Dashboard
Gives sales leaders an overview of team and individual rep performance, including quota attainment, pipe coverage, bookings, pipe generation, closed won business, average sales cycle time, and sales activities.
Default Behavior and Recommended Options
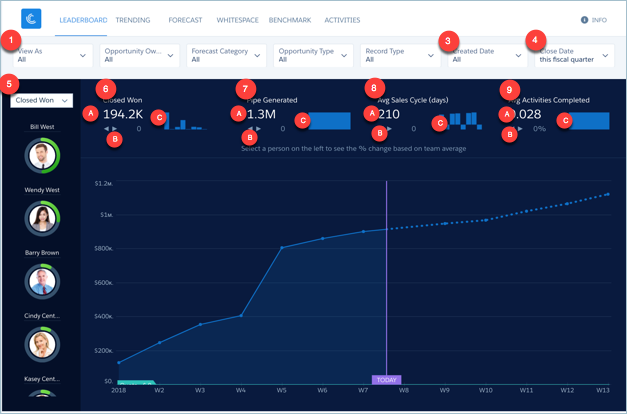
The Leaderboard gives a quick overview of team performance for a given time period. View results for the entire team or for any of your subordinates. The team is made up of sales reps that roll up to the user selected in the View As filter (1), depending on the configuration of the app. (See Wizard and Other Setup Options.)
Select a key performance indicator (KPI) at the top of the left column (2) to view a stacked ranking of your team according to that KPI. Examples of KPIs include the following:
- Quota progress.
- Pipe coverage.
- Open pipe.
- Pipe generated.
- Remaining quota.
- Closed won.
- Completed activities.
- Average sales cycle.
Change the View As filter (1) and view KPIs from that user’s perspective.
The leaderboard column on the left (5) displays opportunity owners only. It does not roll up metrics up the role hierarchy; the Company Overview dashboard provides that view.
Wizard and Other Setup Options
Quotas. Dashboard automatically includes quota information from Salesforce Forecasting Quotas if your org uses this feature. If it does not, you can manually upload quotas data into the app from an external tool as a CSV file. See Forecasting and Quotas Data in Sales Analytics.
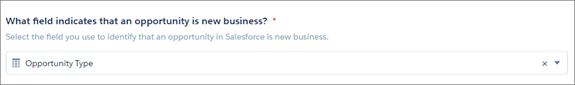
Opportunity Type filter. Values shown determined by selection made in wizard page 5, question 3. By default, the filter uses the standard Opportunity Type field.
Close Date filter. Changes to schedule date if you select Product Schedules on page that lets you add data to the app.
View As filter. Contents of this filter depend on your org:
- If your org uses the Salesforce Forecasting feature in Sales Cloud, the filter lists forecasting managers as defined by the forecast hierarchy.
- If your org defines a role structure/hierarchy but doesn’t use forecasting, the filter lists manager roles as defined by the hierarchy.
- If your org does not define role hierarchy, the filter lists opportunity owners.
Top Deals details chart. Amount column changes to Schedule Amount, Close Date column changes to Schedule Date if you select Product Schedules on page that lets you add data to the app.
Closed won and quota amounts calculated based on
the amount field selected in the wizard, Page 5, Question 1.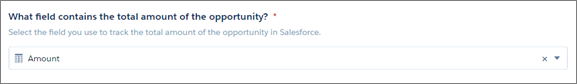
Supports Opportunity Splits if the feature is enabled in your org. See Opportunity Splits.
Datasets Used
- Opportunity
- User Allocation
- Activities
- User
- Opportunity Splits (if you select Opportunity Splits on the wizard page that lets you add objects)
KPI Calculations
- Top of Chart
- Closed Won (6a). Total amount closed won during selected time period. Can include future closed opportunities.
- Closed Won comparison (6b). (Total amount closed based on selected user in View As filter - Average total amount closed by team) / Average total amount closed by team. Team defined by all opportunity owners.
- Closed Won over time (6c). Total amount closed won by quarter for past eight quarters
- Pipe Generated (7a). Based on selections from Created Date (3) and Close Date (4) filters. For example, to see what pipe is generated this period and closes anytime, set Created Date (3) to this fiscal quarter and Close Date (4) to all time.
- Pipe Generated comparison (7b). (Total pipe created by selected user in View As filter - Average total pipe created by team) / Average total pipe created by team.
- Pipe Generated over time (7c). Win rate by month for past three years.
- Avg Days in Sales Cycle (8a). Average of opportunity close date - created date for won opportunities year to date.
- Avg Days in Sales Cycle comparison (8b). (Average cycle for selected user in View As filter - Average cycle by team) / Average cycle by team..
- Avg Days in Sales Cycle over time (8c). Average days to complete (win) sales cycle in the selected period
- Avg Activities Completed (9a). Average number of activities completed per team member in selected time period. Team made up of opportunity owners included in role selected in View As filter (1).
- Avg Activities comparison (9b). (Average cycle for selected user in View As filter - Average cycle by team) / Average cycle by team.
- Avg Activities over time (9c). Activities completed per quarter.
- Upper-Left Filter Options (5)
- Closed Won. Total amount closed won as of close date in selected period per opportunity owner.
- Open Pipe. Total amount open as of close date in selected period per opportunity owner.
- Quota Attainment. Closed won / Quota amount per opportunity owner as of close date and quota date in selected period.
- Remaining Quota. Quota amount - Closed won as of close date and quota date in selected period.
- Pipe Generated. Total amount of opportunities created since created date in selected period per opportunity owner.
- Avg Sales Cycle. Average sales cycle since created date in selected time period per opportunity owner.
- Activities Completed. Number of activities completed in the selected time period per opportunity owner.
- Pipe Coverage. Open pipeline / Remaining quota per opportunity owner in selected period. Values selected in Forecast Category filter impact open pipeline calculation.
-
Top Deals (open opportunities) table (not pictured)
- Pushed. Number of times an opportunity close date has been pushed to a future date. Only shows opportunities in the table for which the closed date has been pushed into the future at least once.
- Neglected. Opportunities that have not been touched for 60 days. Time period can be changed by editing app dataflow.