
You are here:
Sales Analytics Lead Analysis Dashboard
Boost operational efficiency by taking a close look at your team’s lead conversions. Quickly identify leads that convert the most quickly and visualize the team’s conversion rate. And get a view into top leads by source and region.
Required Editions
| User Permissions Needed | |
|---|---|
| To use CRM Analytics apps: | Use CRM Analytics Templated Apps |
| To use Sales Analytics: | Access Sales Cloud Analytics Templates and Apps |
| To create and manage CRM Analytics apps: | Manage CRM Analytics Templated Apps |
| Edit CRM Analytics Dataflows | |
Default Behavior and Recommended Options
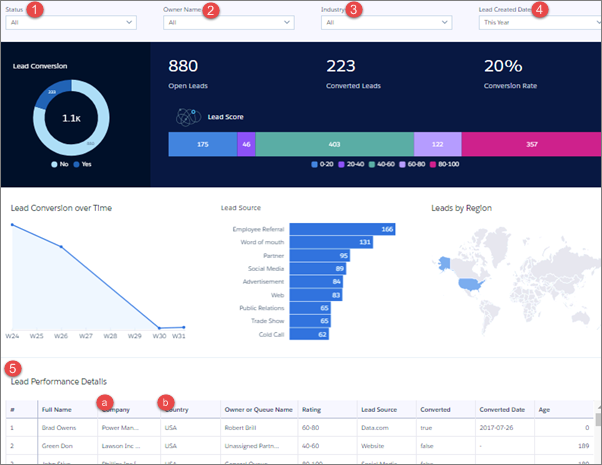
Default view shows leads for the entire team. To see leads according to each team member, select a member’s name from the Owner Name filter (2).
In the Lead Performance Details chart (5), open the action menus from Full Name (a) or Company (b) fields and post to Chatter, create a task or event, or perform another action. Converted leads in Salesforce can’t be edited, so you can’t perform actions from a converted lead.
Wizard and Other Setup Options
Wizard selections made when you create the app determine the labels and values in the KPIs numbered in the image just above. Select basic create or accept default values in custom create to use labels and values from standard Salesforce fields. To customize KPIs, select other fields from the wizard.
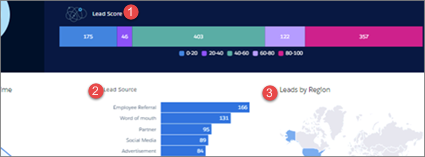
- (1) Lead Score in image, defaults to showing count of leads grouped by their rating. Customize with wizard page 8, question 1.
- (2) Lead Source in image. Defaults to showing count of leads grouped by their source. Customize with wizard page 8, question 2.
- (3) Leads by Region in image. Defaults to showing count of leads grouped by region. Customize with wizard page 8, question 3.
Industry filter (3 in main image at top). Change filter by choosing a field other than Industry in wizard page 8, question 4.
Lead Performance Details chart. Amount column changes to Schedule Amount, Close Date column changes to Schedule Date if you select Product Schedules on page that lets you add data to the app.
Datasets Used
- Leads
- Users
KPI Calculations
Filters Across Top
- Status. Values from your org’s standard Lead Status field.
- Owner Name. Owner or queue name for owner of lead.
- Industry. Values from your org’s Industry field. Can change filter with configuration wizard. See Wizard and Other Setup Options.
- Lead Created Date. Based on Salesforce fiscal year settings.
Top Chart
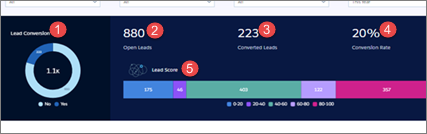
- (1) Lead Conversion. Counts of closed and open leads. (Leads grouped by IsConverted.)
- (2) Open Leads. Total number of open leads created during period selected in Lead Created Date filter.
- (3) Converted Leads. Number of converted leads created during period selected in Lead Created Date filter. Determined by the isConverted flag on Leads. Counts only leads converted to contacts, accounts, or opportunities.
- (4) Conversion Rate. Leads converted / Leads created during period selected in Lead Created Date filter.
- (5) Lead Score. Counts of leads grouped by Rating. Can change grouping with configuration wizard. See Wizard and Other Setup Options.
Middle Chart
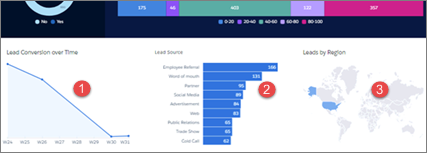
- (1) Lead Conversion over Time. Weekly count of converted leads.
- (2) Lead Source. Count of leads grouped by source. Can change grouping with configuration wizard. See Wizard and Other Setup Options.
- (3) Leads by Region. Counts of leads grouped by region. Can change grouping with configuration wizard. See Wizard and Other Setup Options.