
You are here:
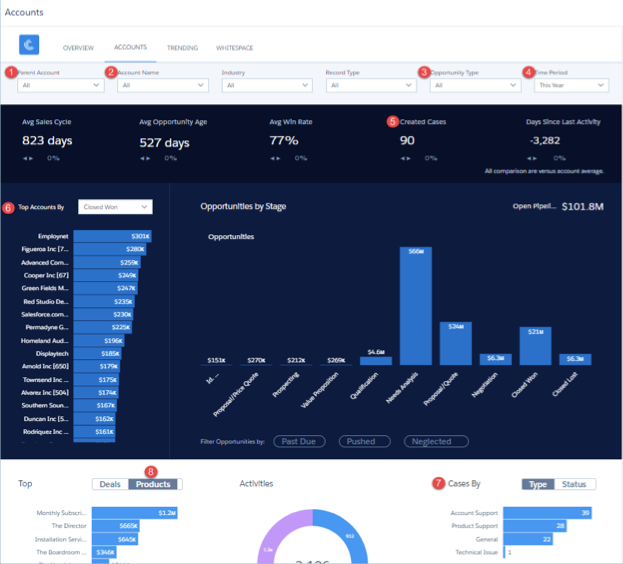
Sales Analytics Sales Rep Accounts Dashboard
A snapshot of opportunity, case, and activity trends to help sales reps stay on top of all their accounts.
Default Behavior and Recommended Options
View data for a specific account by selecting from the Parent Account (1) or Account Name (2) filters along the top or the Top Account widget (6) on the left. The dashboard shows all accounts and related opportunities visible to the person running the app. Percentages at top of main chart compare metrics for the account selected from Top Accounts (6, at left) with totals of all other accounts, based on selections in filters along top.
Wizard and Other Setup Options
Parent Account filter. If you use the standard Parent Account field on the Accounts object, Sales Analytics includes this filter. It’s populated with the account at the top of the hierarchy.
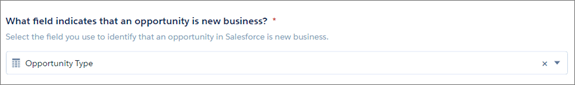
Opportunity Type filter. Values shown determined by selection made in wizard page 5, question 3. By default, the filter uses the standard Opportunity Type field.
Time Period filter. All time periods based on Salesforce fiscal year setting.
Cases widgets. Only included if you use the Cases object in Salesforce and you
select Cases on the wizard page that lets you add objects to your app.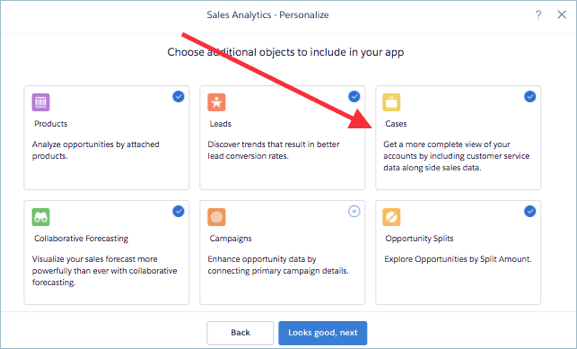
Top Products chart. Uses values from fields selected in wizard page 6, questions 2
and 3.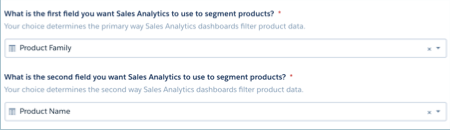
Opportunity Details chart. Amount column changes to Schedule Amount, Close Date column changes to Schedule Date if you select Product Schedules on page that lets you add data to the app.
Datasets Used
- Accounts
- Opportunities
- Oppty Products (if you select Products on the wizard page that lets you choose to add objects)
- Cases (if you select Cases on the wizard page that lets you choose to add objects)
- Activities
- Quota
KPI Calculations
Top of Main Chart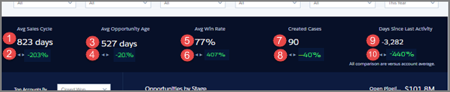
- Avg Sales Cycle (1). Average of (opportunity close date - created date) for won opportunities.
- Avg Sales Cycle comparison (2). (Average cycle for account selected - Average cycle for all accounts depending on filter selections) / Average cycle for all accounts depending on filter selections for closed won opportunities.
- Avg Opportunity Age (3). Average of current date- created date for open opportunities.
- Avg days in sales cycle comparison (4). (Average cycle for selected account - Average cycle for all accounts depending on filter selections) / Average cycle for all accounts depending on filter selections for open opportunities.
- Avg Win Rate (5). Total won/ (Total won + Total lost).
- Avg Win Rate comparison (6). (Win rate for selected account - Win rate for all accounts depending on filter selections) / Win rate for all accounts depending on filter selections.
- Created Cases (7). Total count of created cases in selected period.
- Created Cases comparison (8). (Created cases for selected account - created cases for all accounts depending on filter selections) / Created cases for all accounts depending on filter selections.
- Days Since Last Activity (9). Today - Last update date or Last activity date.
- Days Since Last Activity comparison (10). (Days since last activity for selected account - Days since last activity for any account depending on filter selections) / Days since last activity for any account depending on filter selections.
Main Chart Area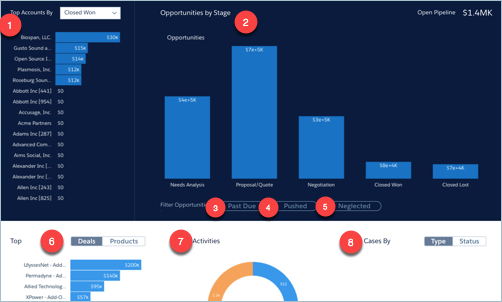
- Top Accounts By…(1). Shows top accounts for selected period. Can filter by Closed Won Amount, Avg Sales Cycle, #Activities Completed, or Open Pipeline.
- Opportunities by Stage (2). Shows amounts for selected period. Further filter by:
- Past Due (3). Opportunities with close date in the past.
- Pushed (4). Opportunities with close date pushed to future at least one time.
- Neglected (5). Opportunities with no activity in at least 60 days.
- Top deals or products (6). Products toggle included if you select Products on the wizard page that lets you add objects to your app. Amounts based on selections from top charts.
- Activities (7). Total number of activities by type.
- Cases By (8). Only included if you use the Cases object in Salesforce and you select Cases on the wizard page that lets you add objects to your app. Select either Type or Status.