
You are here:
Sales Analytics Sales Performance Dashboard (Operations)
Sales leaders: Drill into your closed business by geography, account, product, source, or other criteria to get a 360-degree view of the team’s operational efficiency.
Default Behavior and Recommended Options
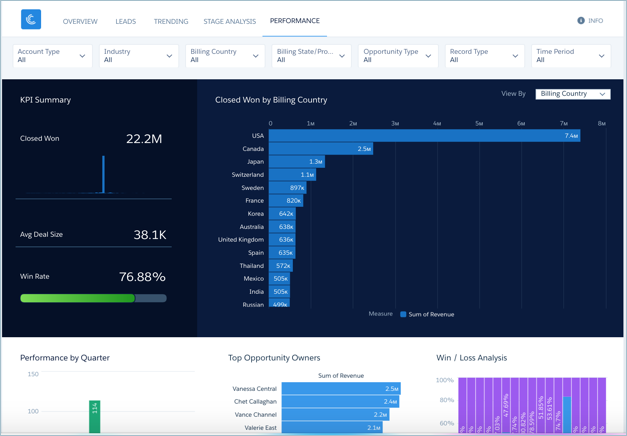
View all performance KPIs through a single dashboard filtered by the type of data you want to view.
In the main chart, change the View By filter (top right) to group data by dimensions available in your org. The title and type of the chart change to reflect the data being shown. The image shows deals grouped by Billing Country in a map. Data grouped by product or account type is displayed with the titles Performance by Product or Performance by Account Type in a bar chart. The chart also shows closed won deals by default. Select Period Over Period in the Display filter to get a comparative view of closings over time. The period being compared depends on the selection in the Time Period filter. If you select This Quarter, for example, the chart compares the time to date in this quarter with the same period in the previous quarter.
Wizard and Other Setup Options
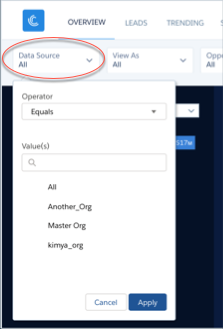
Wizard selections made when you create the app determine the labels and values in the following filters (shown at top of image). Select basic create or accept default values in custom create to use labels and values from standard Salesforce fields. Select other fields from the following wizard questions to customize filters:
- Account Type in image. Wizard page 4, question 1. Opportunity Type in image. Wizard page 5, question 3.
- Industry in image. Wizard page 4, question 2.
- Billing Country in image. Wizard page 4, question 4.
- Billing State/Province in image. Wizard page 4, question 5.
- Opportunity Type in image. Wizard page 4, question 3.
Other filters can’t be customized. Selections they contain are determined by the app and/or values in your org.
Opportunity Details chart. Amount column changes to Schedule Amount, Close Date column changes to Schedule Date if you select Product Schedules on page that lets you add data to the app.
Datasets Used
Uses Opportunity Products if you add products to the app. Otherwise uses Opportunities.
KPI Calculations
Header at Top and Main Chart
- Closed Won for period selected in Time Period filter (year, month, and so on). Closed won total based on close date within the selected period. Can include future closed opportunities.
- Avg Deal Size. Average size of won opportunities based on filter selections.
- Win Rate. Total amount won / Total amount closed based on filter selections.
- Closed Won by chart at right shows closed won opportunities based on View By filter selection (Billing Country in image).
Charts at Bottom
- Performance by Quarter. Quarter / Same quarter previous years.
- Top Ten Opportunity Owner. Top opportunity owners by amount.
- Win / Loss Analysis. Total amount closed grouped by IsWon.