
You are here:
Sales Analytics Opportunity Dashboard (Embedded)
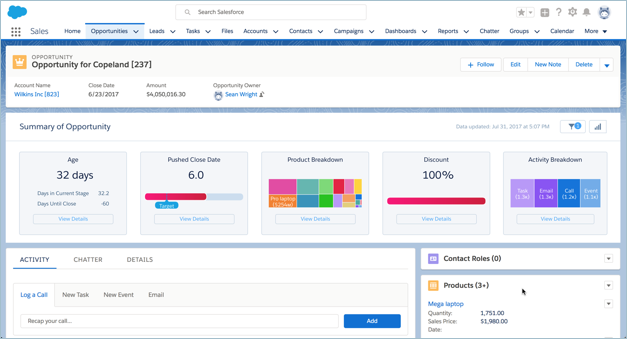
Get a summary of an opportunity. You embed the dashboard in a Salesforce opportunity page.
Default Behavior and Recommended Options
Embed the dashboard in either Lightning and Aloha page layouts.
Edit the dashboard to set target lines and set the upper bounds for gauges. With the
dashboard open in Analytics Studio, click the edit icon ![]() to open
the designer, then click the widget you want to edit. Then look for the value you want to
change in the properties panel on the right and change it there. Save the dashboard.
to open
the designer, then click the widget you want to edit. Then look for the value you want to
change in the properties panel on the right and change it there. Save the dashboard.
Wizard and Other Setup Options
To add this dashboard to your app, select Products on the wizard page that lets you add objects to the app.
Datasets Used
- Opportunity Products
- Activities
Embedding Syntax
Here’s the syntax for embedding the dashboard in either Salesforce Classic or Lightning
Experience Opportunity page layout. Note the difference between using a filter for single
accounts or account hierarchy. Opportunity is the
developer name for the opportunity dataset. Use the exact developer name of the dataset when
embedding the dashboard.
Salesforce Classic
{"datasets": { "opportunity": [{"fields": ["Id"] ,"filter": { "operator":
          "in", "values": ["$Id"] } } ]}}
Lightning Experience
{'datasets': { 'opportunity': [{'fields': ['Id'] ,'filter': { 'operator': 'in', 'values': ['$Id'] } }
      ]}}
KPI Calculations
- Age. Number of days opportunity has been open; Today’s date - Created date.
- Days in Current Stage. (Not shown.) Number of days the opportunity has spent in the current stage.
- Days until Close. (Not shown.) Expected close date - today’s date
- Pushed Close Date. Number of times the close date has been pushed into the future.
- Product Breakdown. Grouping of product names according to product total price.
- Discount. (Product total price for all products attached to the opportunity/ Product list price)
- Activity Breakdown. Number of Activities (open or closed) broken down by activity type.