
You are here:
Sales Analytics Trending Dashboards
View company, team, and pipeline changes for a given period, including beginning and end values of the pipe as well as what’s moved in and out.
Default Behavior and Recommended Options
Dashboards show the pipeline for all opportunity owners rolling up to the manager using the app. Depending on which dashboard you view, choose another user to change opportunity owners reflected in the chart.
- Team Trending (shown): Change opportunity owner using the Forecast User/Manager Role/Opportunity Owner filter (Forecast User in image). Filter name changes depending on how your org is set up. See Wizard and Other Setup Options.
- Company Trending: Change opportunity owner using the View As filter.
- Trending (individual): Change opportunity owner using the Opportunity Owner filter.
The dashboard supports only fields within the opportunity history table. Even if you select a custom amount field in the wizard, the dashboard contains only the standard opportunity amount field. Filters at the top use only current opportunity values; they don’t reflect historical values. For example, if the owner of the opportunity has changed, historical data does not reflect the change.
The dashboard does not support opportunity splits.
Wizard and Other Setup Options
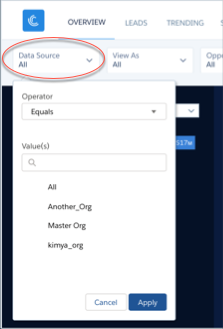
View As filter: Contents of this filter depend on your org.
- If your org uses the Salesforce Forecasting feature in Sales Cloud, the filter lists forecasting managers as defined by the forecast hierarchy.
- If your org defines a role structure/hierarchy but doesn’t use forecasting, the filter lists manager roles as defined by the hierarchy.
- If your org does not define role hierarchy, the filter lists opportunity owners.
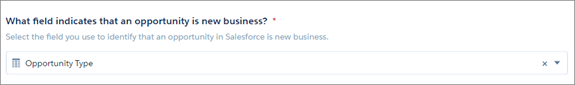
Opportunity Type filter. Values shown determined by selection made in wizard page 5, question 3. By default, the filter uses the standard Opportunity Type field.
Datasets Used
Pipeline Trending, including data from Opportunity History.
KPI Calculations
Time period filters
Time periods based on Salesforce fiscal year setting.
- Set Pipeline Start and End Dates. Select the start and end dates for when you want to view the pipeline. Click Year, Quarter, Month, Weeks, or Days to indicate unit of time. Then either click edit icon and type in a number or drag slider handles to set the start and end for the period you want to view. For example, click Quarters, then drag left handle to -3 and drag right handle to +1 to view pipeline starting three quarters ago until one quarter from now.
- Set Close Date for Opportunities. Select the close date for the opportunities you want to include in your view of the pipeline.
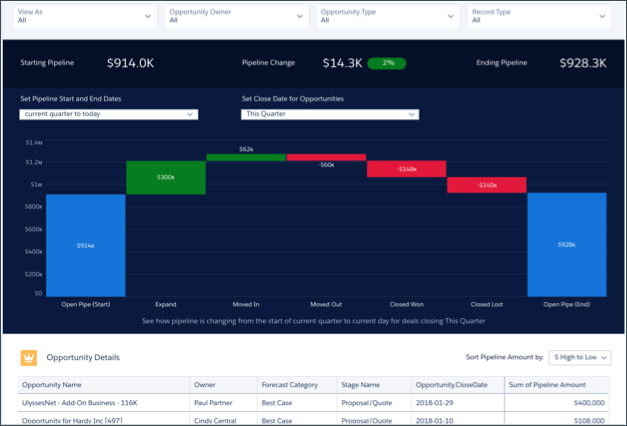
Main (Waterfall) Chart
-
Values along top
- Starting Pipeline. Total amount open during the selected starting period.
- Pipeline Change. (Total amount open during selected starting period - total amount open during selected end period/ Total amount open during selected starting period). Does not include future closed opportunities.
- Ending Pipeline. Total pipeline at the end of the period.
-
Values in vertical bars
- Open Pipe (Start). Total pipeline at the start of the time period.
- New. Opportunities created after the start period.
- Expand. Existing opportunities in which total amount was increased since start of the period.
- Moved In. Opportunities with close dates moved into the selected time period. (Where close date was changed after start of the period.)
- Moved Out. Opportunities with a close date that no longer falls within the selected time period. (Where close date was changed after start of the period.)
- Reduce. Opportunities in which total amount is less than at the beginning of the period.
- Closed Won. Opportunities closed won after the beginning of the period.
- Closed Lost. Opportunities lost after the beginning of the period.
- Open Pipe (Today). Total pipeline at the end of the period.