
You are here:
Sales Analytics Team Whitespace Dashboard
Use this dashboard to uncover resell and upsell opportunities by viewing whitespace. Whitespace means accounts that you can revisit to create business.
Required Editions
| User Permissions Needed | |
|---|---|
| To use CRM Analytics apps: | Use CRM Analytics Templated Apps |
| To use Sales Analytics: | Access Sales Cloud Analytics Templates and Apps |
| To create and manage CRM Analytics apps: | Manage CRM Analytics Templated Apps |
| Edit CRM Analytics Dataflows | |
Default Behavior and Recommended Options
Start by viewing products your team or individual reps have sold by account and what’s in the pipeline. You can also see accounts not associated with products and products that have not been sold to any account. Use filters to group similar accounts to spot product whitespace.
Team version shows accounts where you and subordinate members of your team are named owners or other accounts that you can see based on security settings in your org.
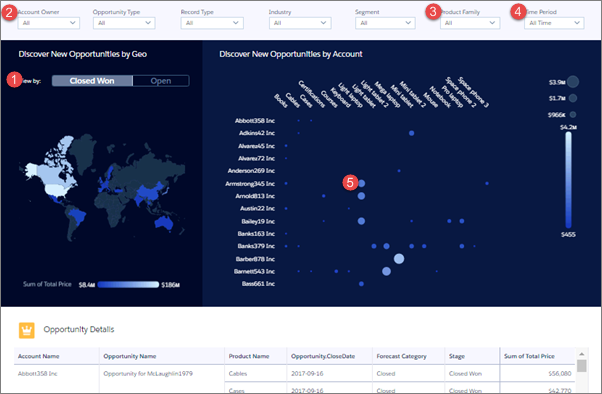
Opens to all closed won and open deals for a given time period for the entire team or an individual rep. Click Closed Won (shown in image) or Open in the View by toggle (1) to see just those deals. Select a sales rep’s name from the Account Owner filter (2) to view deals for that rep. Change the Product Family (3) or Time Period (4) filters to narrow time period and specific products.
Position cursor over a bubble (5) to see the size of a deal and which products are involved. Bubble sizes increase according to the amount of the deal. Click the bubble to open the details, then take action from the opportunity to recommend steps to pursue a new opportunity.
Wizard and Other Setup Options
Sales Analytics includes this dashboard only if you select Products on the wizard page that lets you add objects to your app.
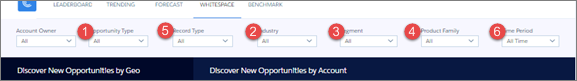
Wizard selections made when you create the app determine the labels and values in the filters numbered in the image. Select basic create or accept default values in custom create to use labels and values from standard Salesforce fields. Select other fields from the following wizard questions to customize filters:
- Opportunity Type in image. Wizard page 5, question 3. Product Family in image. Wizard page 6, question 2.
- Industry in image. Wizard page 4, question 2.
- Segment in image. Wizard page 4, question 1.
- Product Family in image. Wizard page 6, question 2. Only available if you add products to the app on the wizard page that lets you add objects.
Record Type filter (5). Only appears if your org uses record types.
Time Period filter (6). All time periods based on Salesforce fiscal year setting.
Opportunity Details chart. Amount column changes to Schedule Amount, Close Date column changes to Schedule Date if you select Product Schedules on page that lets you add data to the app.
Datasets Used
- Accounts
- Products
- Oppty Products
Combination of these three datasets lets you view accounts with or without products and products with or without opportunities with accounts.
KPI Calculations
Main Chart
Shows product total price by account for the selected period for either closed won, open, or both depending on selected filters. Row visibility settings from Opportunities dataset determine which accounts appear in the chart.