
You are here:
About Sales Analytics
Learn the benefits of Sales Analytics before you create and use the app to explore your Sales Cloud data.
Required Editions
| Available in Salesforce Classic and Lightning Experience. |
| Available with CRM Analytics, which is available for an extra cost in Enterprise, Performance, and Unlimited Editions. Also available in Developer Edition. |
| User Permissions Needed | |
|---|---|
| To use CRM Analytics templated apps: | Use CRM Analytics Templated Apps |
| To use Sales Analytics: | Access Sales Cloud Analytics Templates and Apps |
| To create and manage CRM Analytics apps: | Manage CRM Analytics Templated Apps |
| Edit CRM Analytics Dataflows | |
Salesforce created Sales Analytics to make it easy to analyze Sales Cloud data. Whether you’re a sales executive or manager, a rep, or on the operations side, Sales Analytics gives you a new level of insight into your Salesforce data. Start with the Sales Analytics Home dashboard to see the latest wins, win rate, average deal amount. Dig in to all the other dashboards from there, which take advantage of Salesforce Forecasting in Sales Cloud to show quotas and help you pinpoint forecasting.
- Execs get their own overview highlighting pipeline and sales and service business performance as well as top deals. They can easily jump to dashboards with all the details.
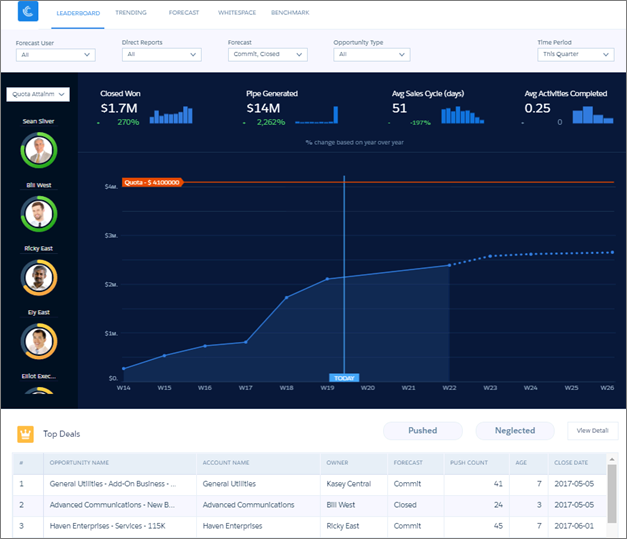
- Managers can start with a leaderboard showing team key performance indicators (KPIs) and dive right in to specifics about quota, changes in the pipeline, team trending, and average sales cycle time. They can also focus on the performance of members of their team and take action to accelerate business closings.
- Reps can view their own quota attainment, bookings, and pipe activities for a given period. They can also quickly find opportunities for new business to help hit their quotas.
- Operations staff can sort through performance by geography, source, and customer to spot trends to help speed new deals.
App creation is easy. Sales Analytics runs a compatibility check against your org to be sure it includes all the data to create the app’s datasets and dashboards. If your org doesn’t have the required data, error messages tell you what you need to add before creating the app.
When the compatibility check determines that your org is ready, you have two options:
- Quickly create the app using standard, default settings as determined by Sales Analytics during the compatibility check. Default settings include forecasting data to show quotas in app dashboards if your org uses the Salesforce Forecasting feature in Sales Cloud.
- Use the built-in configuration wizard to choose your own, custom settings to reflect the way you and others on your team want to view data.
When you’ve created the app, use its prebuilt dashboards to explore Sales Cloud data from any device that supports CRM Analytics.
You get actionable insights fast from your sales data using the intuitive CRM Analytics interface. And you can drill deeper into key aspects of your business by customizing Sales Analytics around your business needs.