
You are here:
Sales Analytics Lenses
Sales Analytics lenses augment app dashboards with targeted visualizations of your org’s sales data.
| Lens Name | Contents | Edit Through User Interface? |
|---|---|---|
| Explore Opportunities | Details about opportunities, starting with pushed opportunities. Narrow the time period to look at pushed opportunities for a year, quarter, month, and so on. Select a new grouping, such as by team or by opportunity owner. Filter by a different stage, status, product, or any other way you break down opportunities to get a more refined view of opportunities in your pipe. | Yes. |
| Historical Pipeline By Forecast | Augments Team Trending dashboard with detail about the pipeline for the past six months broken out by forecast status. | No. Requires SAQL editing. For advanced users only. |
| Historical Pipeline By Stage | Augments Team Trending dashboard with detail about the pipeline for the past six months broken out by sales stage. | No. Requires SAQL editing. For advanced users only. |
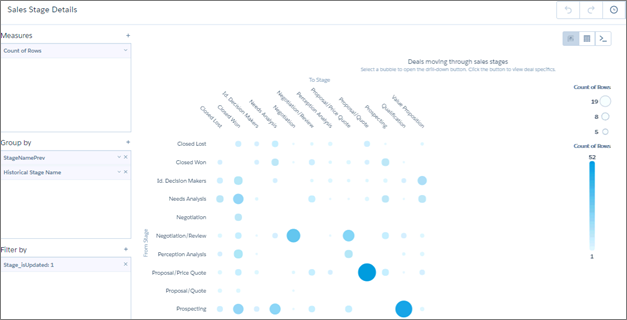
| Sales Stage Details | Augments Sales Stage Analysis dashboard, shows where specific deals stand in the sales process. Select a bubble in the chart and click the drill-down button at top right to learn specifics about a deal (for example, forecast category, stage, owner, age). | Yes. |
Did this article solve your issue?
Let us know so we can improve!