
You are here:
Service Analytics Prebuilt Dashboard and Datasets
The Service Analytics app includes prebuilt dashboards and datasets to accelerate data exploration for both service managers and agents.
Required Editions
| User Permissions Needed | |
|---|---|
| To use CRM Analytics apps: | Use CRM Analytics Templated Apps |
| To use Service Analytics: | Access Service Cloud Analytics Templates and Apps |
| To create and manage CRM Analytics apps: | Manage CRM Analytics Templated Apps |
| Edit CRM Analytics Dataflows | |
Service Analytics Dashboards
Service Analytics prebuilt dashboards contain best practices that help you get value from your Salesforce data—fast. The dashboards let you manage service cases and forecast and understand key business performance drivers, visualize trends, and assign actions. They also help you get fast answers to questions you have about your service business’s results.
Dashboards available from the app provide a complete view of service customer data that includes all your key service performance indicators in one place. Managers can quickly view average case closing times, customer satisfaction, trendings, and historical and peer benchmarks. They can also get insight into the teams’ use of knowledge to resolve cases and other data so they can quickly take appropriate action.
Another set of dashboards -- called sidebars -- are specifically for service agents. Embed sidebars in a Salesforce page, such as the service console, to make them more accessible to agents during their day-to-day work. For a given case, an agent can view customer history, number of cases, and CSAT. Agents can also see previous customer actions and their result so they can find out what worked. The goal is to provide agents the right amount of information at the right time to help them take the right action.
The following table guides you through Service Analytics dashboards. You can also explore further on your own at any point. To learn more about exploring data in CRM Analytics, see Explore and Visualize Your Data in CRM Analytics.
| Dashboard Name | Contents | Target User |
|---|---|---|
| Service Analytics Overview (Service Manager Overview) | Start here. Summarizes key performance indicators (KPIs) from your Service Cloud, including open cases in the backlog, agent average time to close, and first contact resolution rate. Helps you gauge health of the business and surface issues requiring further investigation. Also, provides springboard to all other dashboards. | Service manager |
| Account Profile | Provides a full breakdown of a selected customer’s service history and current backlog and includes customer satisfaction (CSAT) data and trends. If you track Opportunity data, you can also see pending and closed deals. | Service manager |
| Agent Activity | Helps determine how well agents use their time. Shows how much work agents do and how their work aligns with case-closing numbers and duration as well as CSAT. | Service manager |
| Agent Performance | Shows agent and team performance against key activity and customer satisfaction metrics. Performance trends and benchmarks on agent performance help you provide direction and drive agent success. | Service manager |
| Channel Review | Shows CSAT and activities—duration and volume—on cases by channel to help you monitor success of each channel. | Service manager |
| Backlog | Gives complete view of your backlog to show how efficiently your team resolves cases and how quickly your backlog is growing. Helps you prioritize and acquire/assign resources accordingly. | Service manager |
| Customer Satisfaction | Highlights CSAT measures so you can identify specific areas to improve the service experience. Indicates most/least satisfied customers and associates agents, products, and channels with CSAT. | Service manager |
| Knowledge Impact | Provides a view into how knowledge articles attached to cases impact CSAT and resolution time. See which agents used the most articles to determine who needs training/coaching in the use of knowledge to help resolve service issues | Service manager |
| Knowledge Use | Helps you understand how agents use knowledge articles to help you drive article creation. See which articles are attached the most and the least and which have the most views or votes (high ratings) over time. | Service manager |
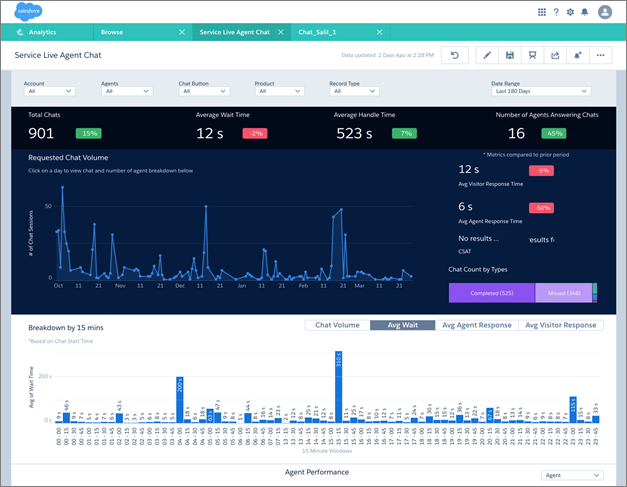
| Chat | Shows how your team uses chat to help solve support cases. Includes number of chats, days of the week with most activity, missed or abandoned chats, chat length, and average handle time. | Service manager |
| Omni | Gives managers insight into agent utilization based on Omni-Channel work record tracking. Includes incoming agent work volume, average speed to answer, average handle time, average active time, and other agent utilization metrics. | Service manager |
| Open Cases | Shows current open case workload to help you prioritize, investigate problematic cases, and view escalations and SLA compliance. Let’s you prioritize cases by accounts and pending deals so you can take appropriate action. | Service manager |
| Telephony | Helps you understand the impact of phone contact with customers during service case resolution. Filter call volume and duration by inbound or outbound call, the result of the call, and other factors. Also relates call volume to agent performance. | Service manager |
| Sidebar – By Customer | Provides a snapshot of customers, including the service products they’re using, case reason, and priority. Also shows which agents have helped customers and provides a CSAT overview. | Service agent |
| Sidebar – By Similarity | Shows a snapshot of historical data to help guide further customer interactions. Shows if there are other cases similar to the ones they’re resolving. Helps agents identify potential product issues or candidates for creating knowledge and find agents who have worked similar cases. | Service agent |
| Sidebar – By Case History | Gives an overview of case history or lifecycle so agents can be more informed during customer conversations. Includes a snapshot of case interactions and duration of case against the average. | Service agent |
| My Performance Summary | Gives agents visibility to their own productivity so they’re always aware of their results towards targets as tracked in Salesforce. Includes ranking within the support center, trends, and benchmarking so they’re always prepared for meetings with managers and reviews. Typically results in higher agent satisfaction and performance and lower turnover rates. | Service agent |
Service Analytics Datasets
The table lists all the possible standard datasets that become part of Service Analytics when you create the app.
| Dataset Name | Contents |
|---|---|
| Service Activity | Replaces Service Event and Service Task datasets used in Classic version of app. Data about events and tasks associated with cases, including last modified date and case duration. (Your Service Cloud data must include at least one event and one task for Service Analytics dashboards to function correctly.) |
| Service Case | Data about cases, including duration, last modified date, and customer satisfaction measure. |
| Service Case History | Data about case history, including owner, type, and creation date. |
| Service Chat Transcript | One of two Service Analytics datasets with data about your team’s use of Chat usage. Includes data from Chat transcripts, such as response times, numbers of messages per chat, and chat duration. |
| Service Chat Transcript Event | One of two Service Analytics datasets with data about your team’s Chat usage. Includes data about Chat events, such as if chats are accepted, queued, declined, or transferred. |
| Service Knowledge | Data about use of knowledge articles in cases, such as number of views, ratings, last referenced dates, and case associations. |
| Service Knowledge Attached | Data about attachment of knowledge articles to cases including whether articles are shared by email, article version number, and case type. |
| Service Omni Agent Work | One of two Service Analytics datasets with data from Omni-Channel Agent Work object. Includes data that helps you track information about the assignments your agents work on, including the queue, channel, status, and speed to answer. (Your org must use Omni-Channel to create and route work items for Service Analytics to create this dataset. You must also answer Yes to the configuration wizard question about Omni-Channel.) |
| Service Omni User Presence | One of two Service Analytics datasets with data from Omni-Channel User Presence object. User presence records contain fields that help you track information about agent availability. (Your org must use Omni-Channel to create and route work items for Service Analytics to create this dataset. You must also answer Yes to the configuration wizard question about Omni-Channel.) |
| Service Opportunities | Data about opportunities so you can filter cases by opportunity for prioritization and appropriate action. |
| Service Event (Only in Classic version of app.) | Data about events associated with cases, including last modified date and case duration. (Your Service Cloud data must include at least one event for Service Analytics dashboards to function correctly.) |
| Service Task (Only in Classic version of app.) | Data about tasks associated with cases, including last modified date and case duration. (Your Service Cloud data must include at least one task for Service Analytics dashboards to function correctly.) |