
You are here:
Auto-Install Usage
Track the average API calls per hour and the number of dataset rows used per day for all auto-installed apps and for each individual app.
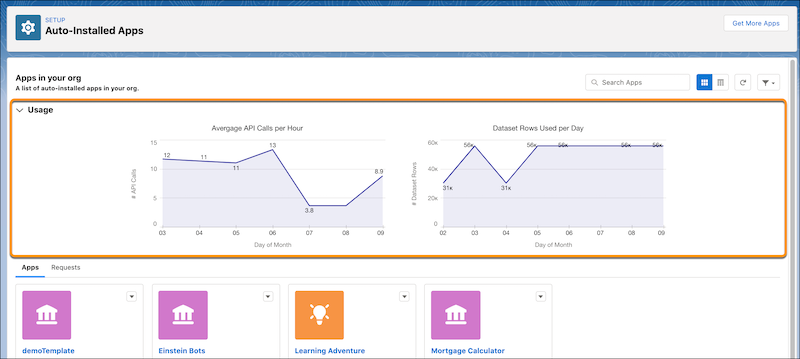
The Usage section on the main page has two charts. The first chart shows you the hourly average of API calls made by auto-installed apps each day. The second chart shows you how many dataset rows the auto-installed apps use per day. Both charts show usage numbers up to the past 7 days.
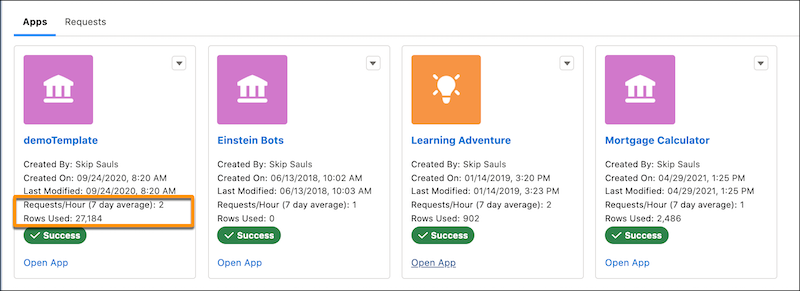
On the Apps tab, in the tile view, each auto-installed app tile shows the usage numbers for that specific app. These numbers include the number of API requests made per hour averaged over 7 days and the number of dataset rows used per day.
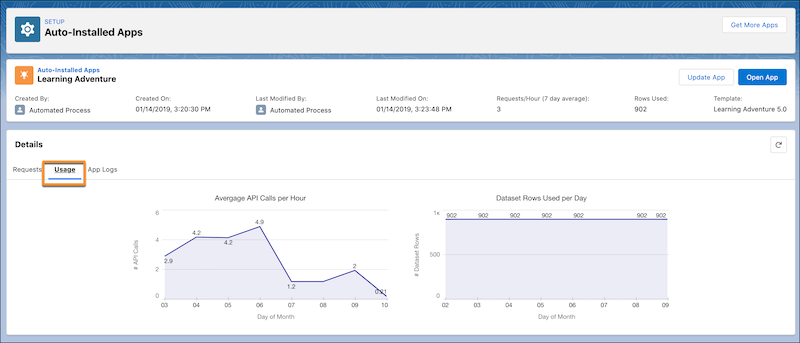
To see the individual app usage numbers in charts, click the app name, and then select the Usage tab. These charts show you the usage statistics specific to this auto-installed app.