
You are here:
Automatically Highlight Data with Conditional Formatting
Don’t delay important decisions because you miss critical changes in your data. With clicks, not code, add rules to automatically format results to quickly catch changes and take immediate action. For example, highlight accounts in red in a bar chart when their CSAT score drops below 80% so that you can get on the phone with those customers.
Use rules to automatically highlight charts and tables in a lens or dashboard as well as number widgets in your dashboard. Stay on top of each KPI by highlighting the highs and lows based on ranges and colors that you specify. Or, distinguish each measure or dimension value (group) by color-coding them.
For example, you can apply conditional formatting to accomplish the following goals.
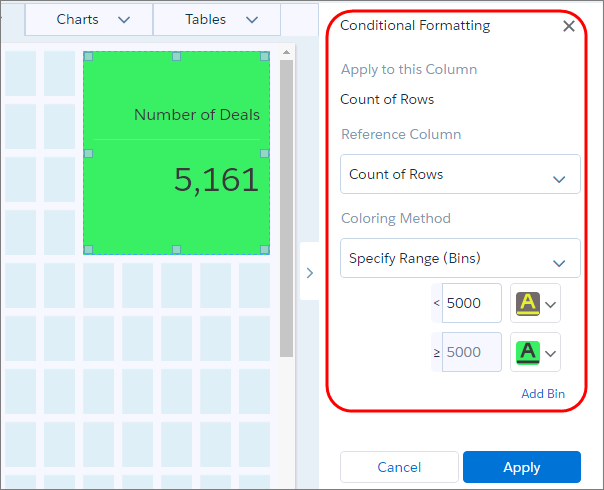
- Determine how well you’re doing on a KPI by coloring the number widget based on its value.
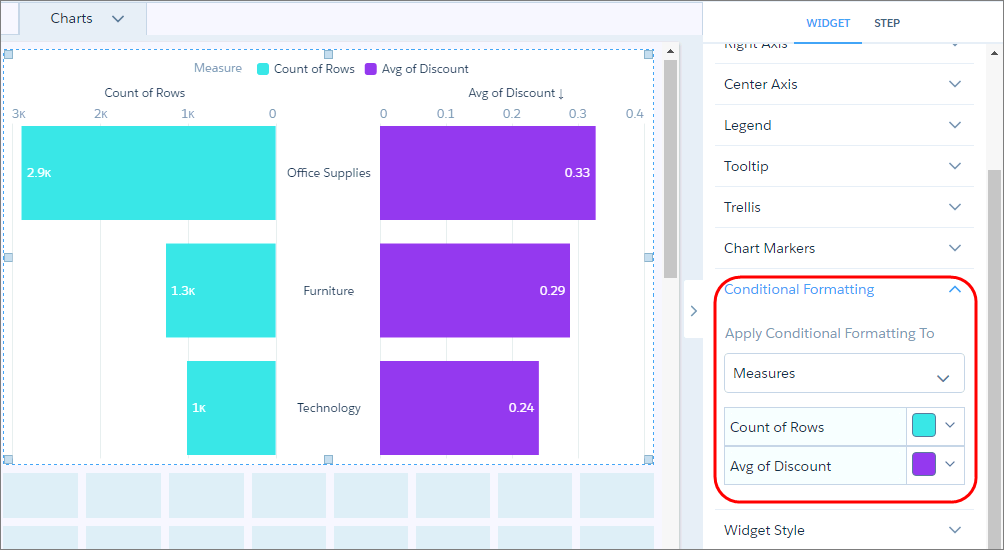
- Distinguish each measure in a chart with a unique color.
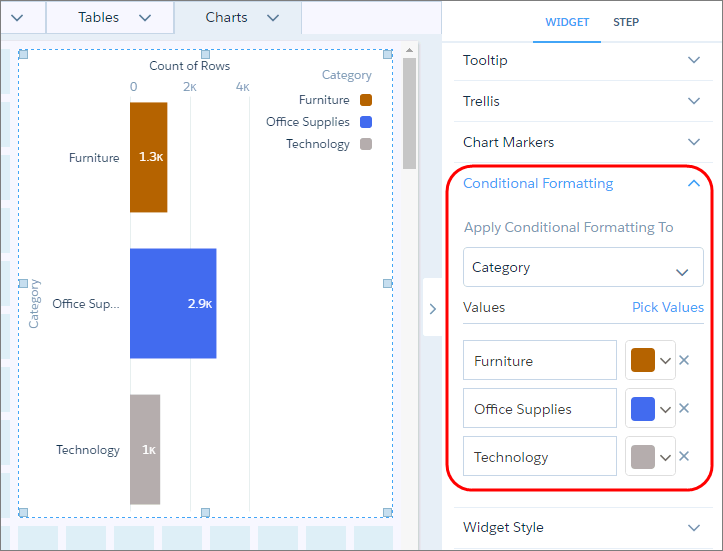
- Similarly, distinguish each dimension value.
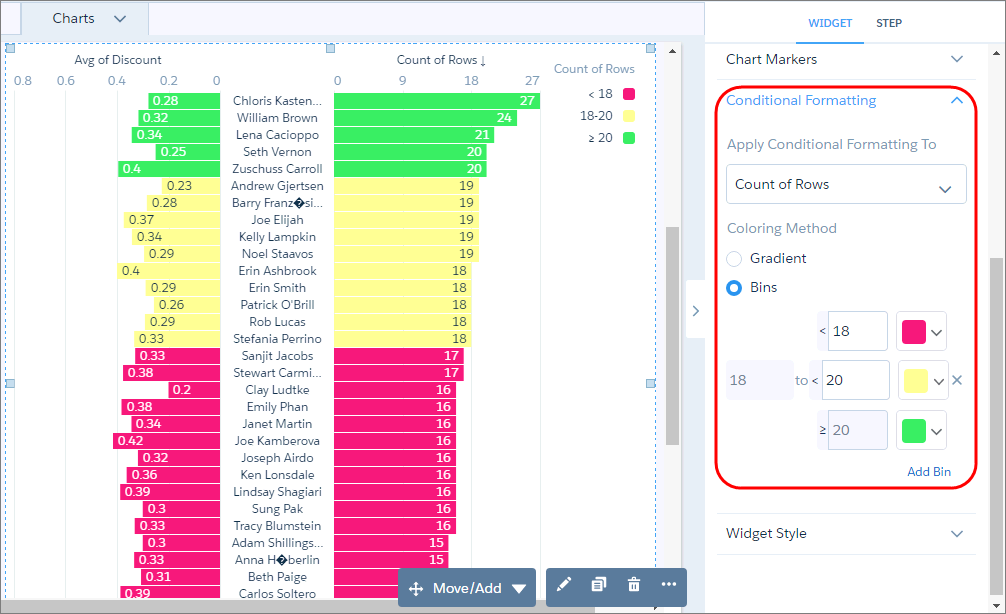
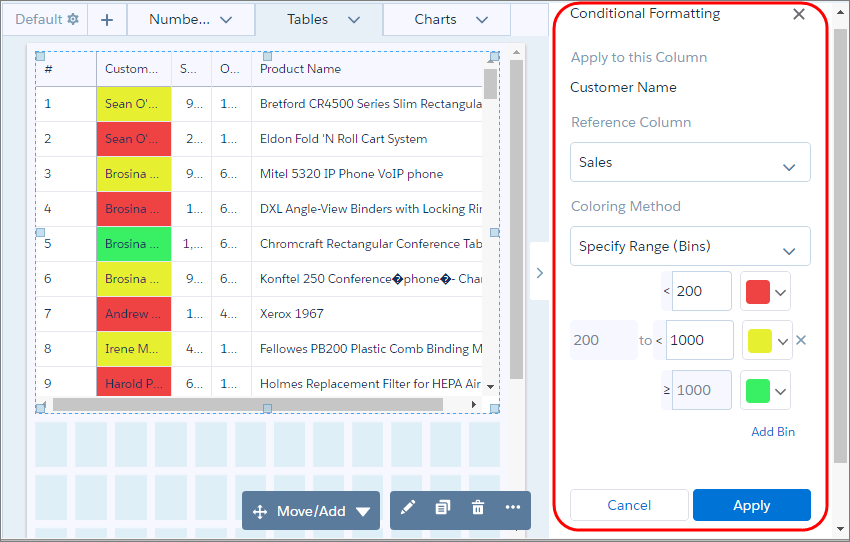
- Determine your top and bottom performers by categorizing numeric values into colored bins.
You can add up to 10 bins.
- Focus on key table records by color-coding the text or background of a column’s cells. In
the following example, the Customer Name column is colored based on the value of the Sales
field.
Set up conditional formatting in the widget properties panel. Although you set it up at the widget level, the formatting applies to the underlying query. Conditional formatting affects all widgets that use the query. If you change the widget or chart type, the formatting is retained. A message appears if the formatting can’t be retained, like when changing between a table and chart widget. Conditional formatting overrides colors set on dimension values in the dataset XMD.
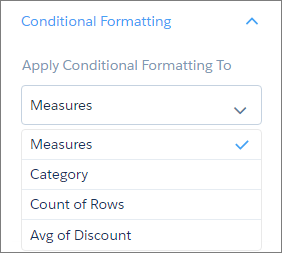
For charts and number widgets, set up conditional formatting in the widget properties. Select Measures to apply a format to each measure. Or select one measure or dimension to apply a format to each of its values.
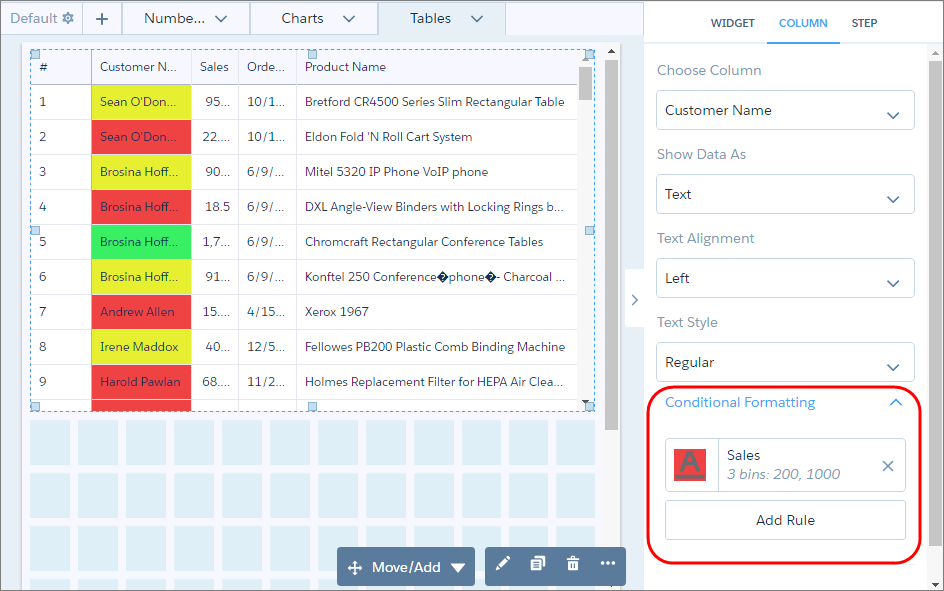
For tables, in the Column tab of the widget properties, select the column that you want to format and then set the rule used to format it. Each table can have multiple conditional formatting rules. You can apply only one rule for each style, like background color or text color in a table.
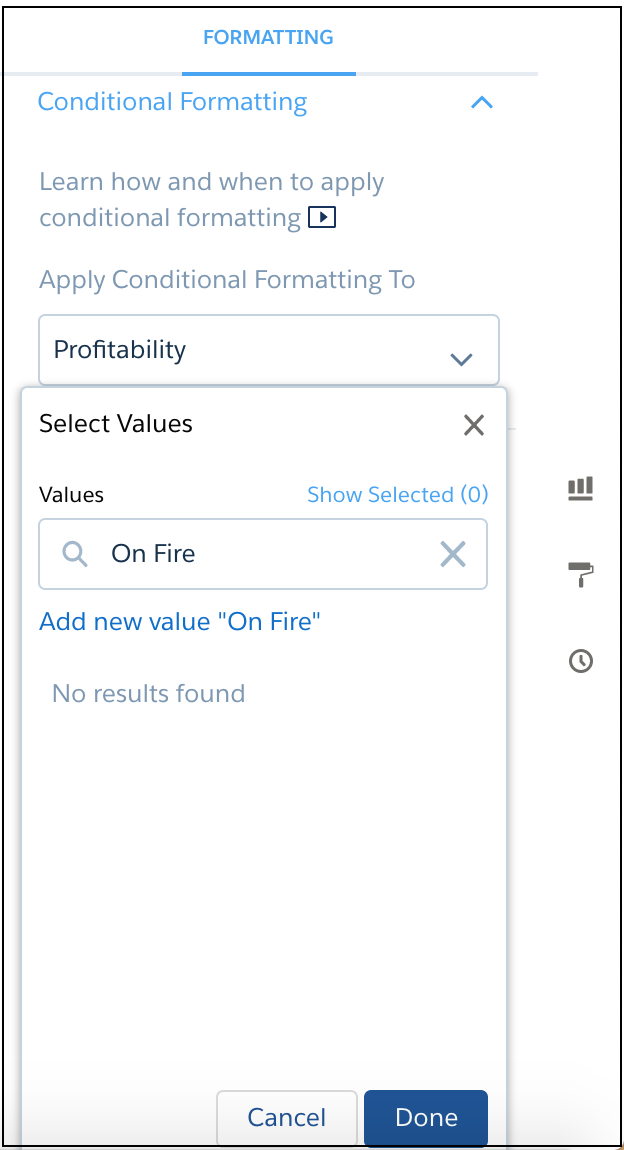
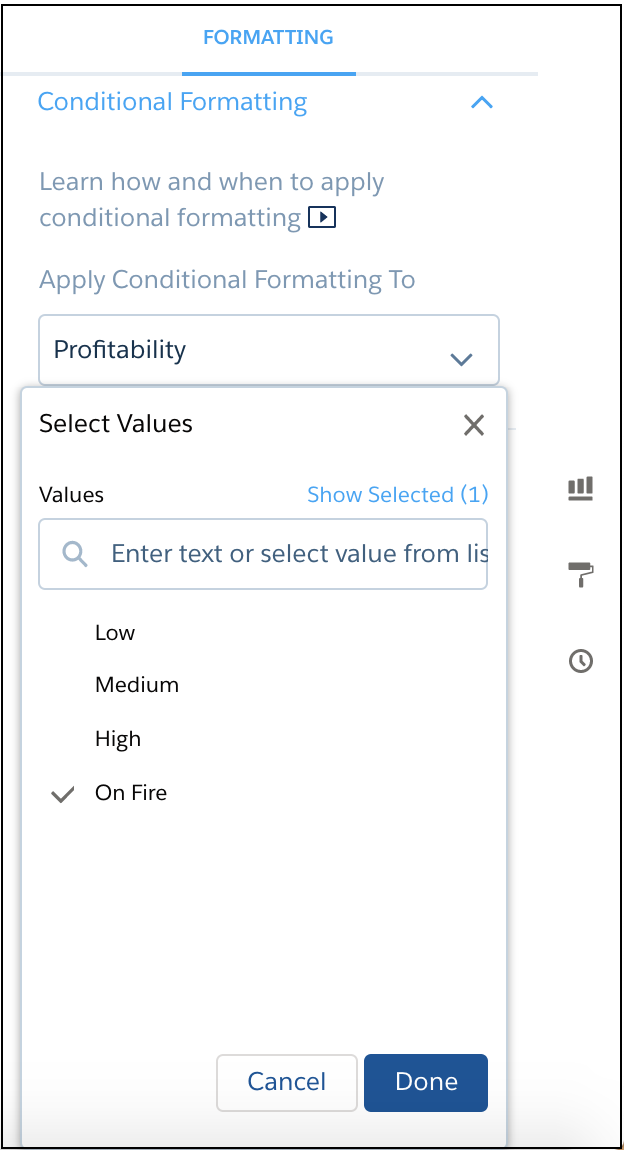
For calculated dimensions, select the dimension and click Pick Values. For Select Values, you can choose previously defined values or enter custom values.
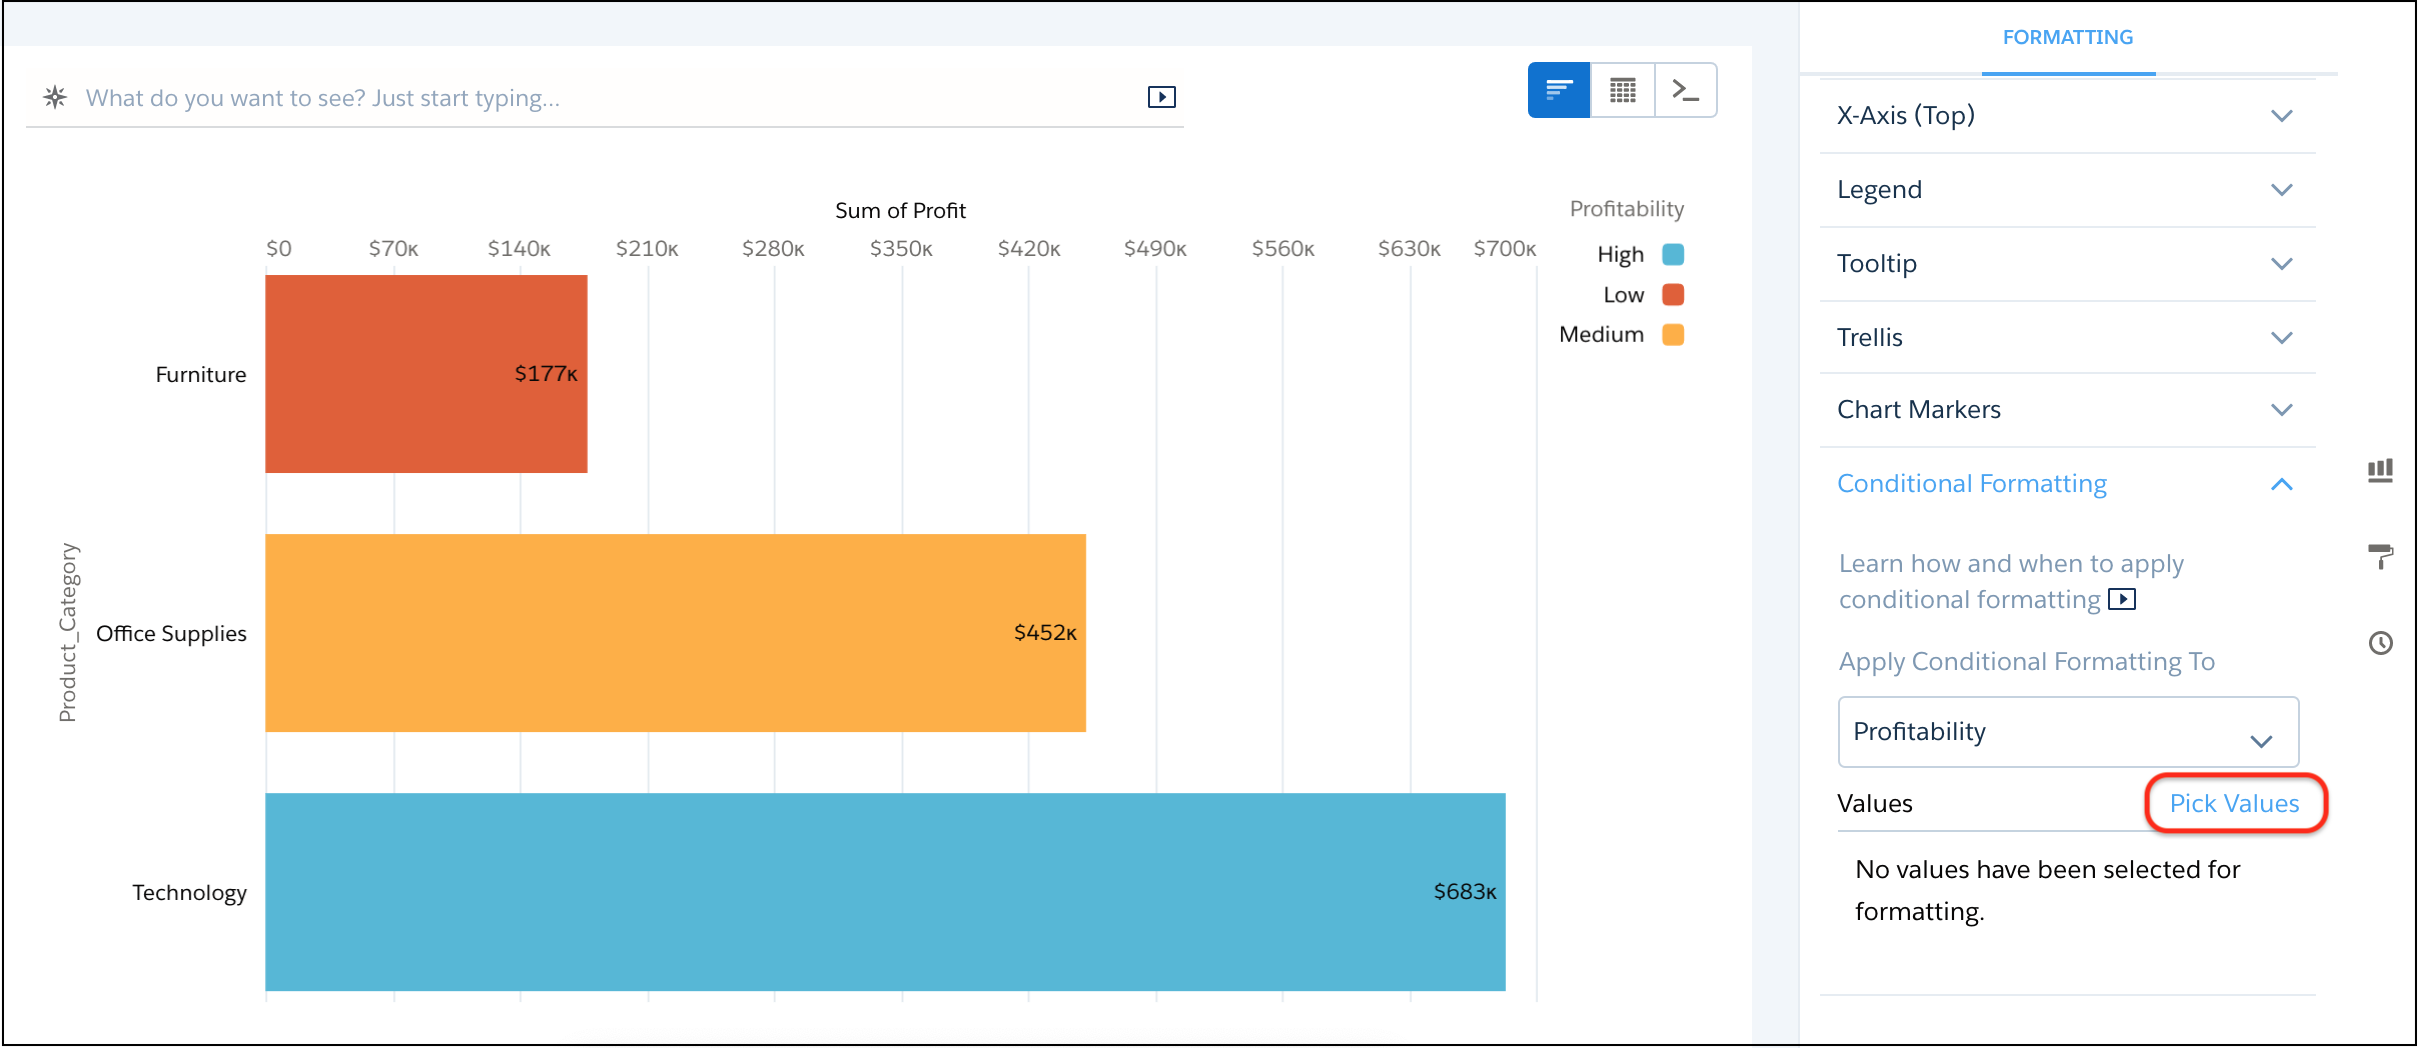
If you enter a custom value, then click to add it to the Select Values list.

|
|
|
- Conditional Formatting Considerations
Keep these considerations in mind when setting up conditional formatting. - Set Up Complex Conditional Formatting
You can set up conditions based on a single reference column in the widget properties. However, sometimes, you have to create more complex conditions. To set up rules based on multiple reference columns for number and table widgets, use SAQL.