
You are here:
Use Dashed Lines for Effect
To differentiate a measure in a line or timeline chart, use a dashed line.
To contrast the line representing the average between the minimum and maximum values of closed opportunities in a timeline chart, for example, click Use Dashed Lines, then choose the measure for the average from the multiselect menu below it.
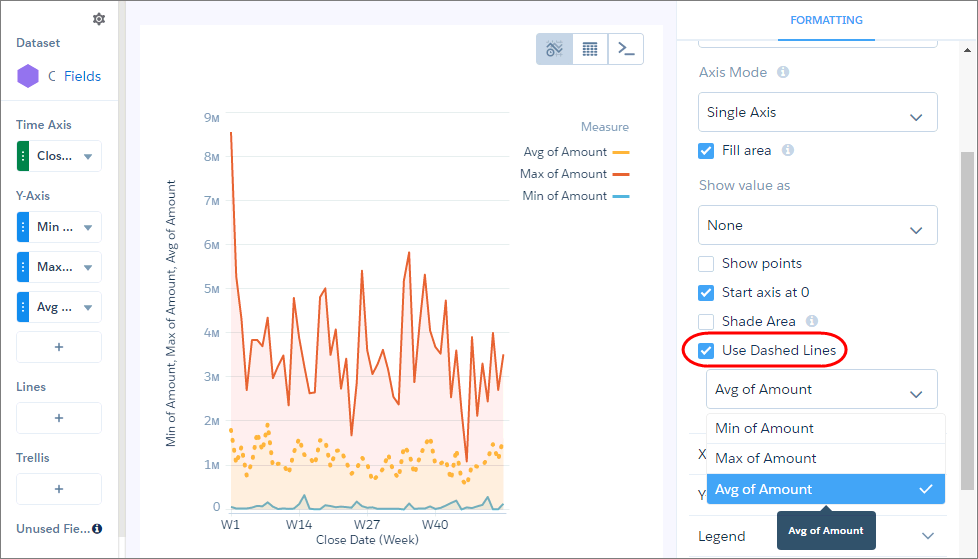
To make other measure lines dashed instead of solid, select them from the same menu.
Did this article solve your issue?
Let us know so we can improve!