
You are here:
Add Icons to CRM Analytics Charts
Bar charts (but not stacked bars), dot-plot charts, and line charts can have icons along with dimension values as labels. Polar gauge charts can include icons in their centers.
To add icons to a chart, use a dataset with an ungrouped URL dimension whose values are URLs to the icon images. For example, each row in the following dataset has a URL that points to a flag image stored in your org:
   Country,Country_code,Region,flag_img_url,Accounts,Value
   Australia,aus,South Pacific,https://MyDomainName.file.force.com/file-asset/flagaustraliapng,1898,22930651
   China,chn,East Asia,https://MyDomainName.file.force.com/file-asset/flagchinapng,2051,29754009
   Europe,eur,Europe,https://MyDomainName.file.force.com/file-asset/flageuropepng,4668,61238042
   France,fra,Europe,https://MyDomainName.file.force.com/file-asset/flagfrancepng,2303,28746829
   India,ind,Asia,https://MyDomainName.file.force.com/file-asset/flagindiapng,2721,32037499
   Italy,ita,Europe,https://MyDomainName.file.force.com/file-asset/flagitalypng,1722,26340986
   Japan,jpn,East Asia,https://MyDomainName.file.force.com/file-asset/flagjapanpng,2872,36916012
   Russian Federation,rus,East Europe,https://MyDomainName.file.force.com/file-asset/flagrussiapng,1847,27387456
   South Africa,zaf,Africa,https://MyDomainName.file.force.com/file-asset/flagsouthafricapng,879,9794857
   South Korea,kor,East Asia,https://MyDomainName.file.force.com/file-asset/flagsouthkoreapng,1643,21934785
   United States of America,usa,North America,https://MyDomainName.file.force.com/file-asset/flagusapng,6527,87044191
After you upload the dataset to CRM Analytics, explore the dataset using only one grouping. Then edit the SAQL query to add the image URLs to the result set.
-
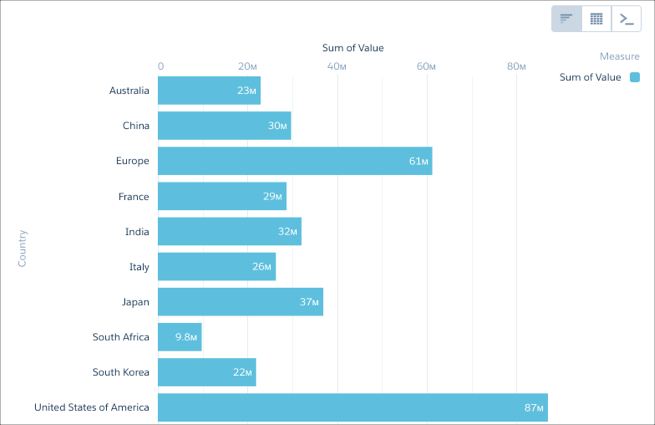
Explore the dataset to visualize the data you want to view in chart mode.
-
Switch to SAQL mode and edit the query using a non-grouping SAQL function such as
first().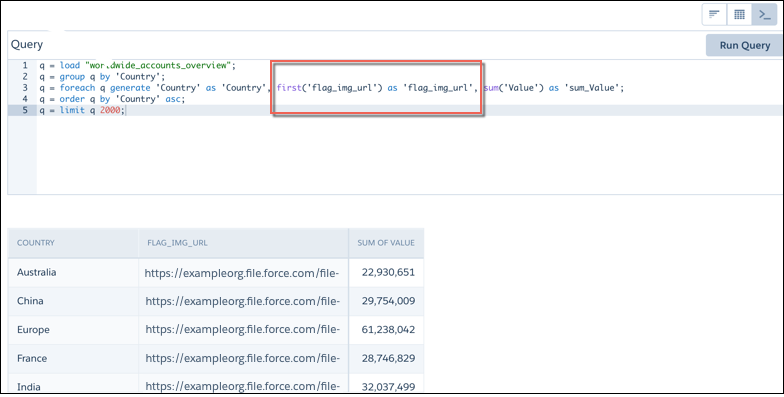
- Return to chart mode, then click the gear menu to open the chart properties.
-
Click Use Icons, then select the name of the dimension
containing the icon URLs from the Icon Source menu.
Use the Fit Mode and Shape menus to adjust the icons’ appearance.
 Note The Use Icons menu contains the name of every non-grouped dimension used in your query, even if these dimensions do not contain image URLs.
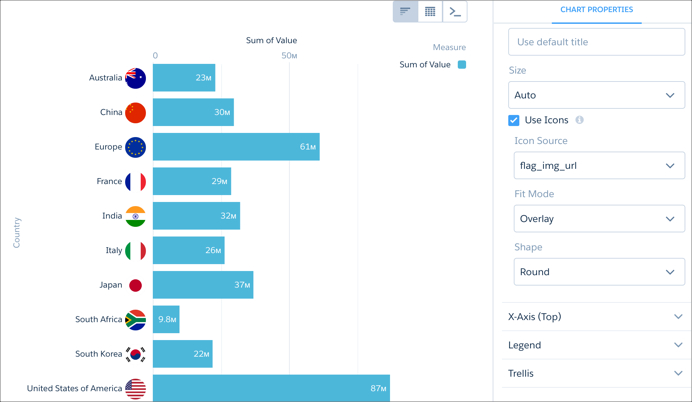
To use Chatter profile images, use your browser's development tools to find the image's underlying URL.
Once you've collected the URLs, add them to a column in your dataset before uploading the dataset to CRM Analytics.
   name,url_src,num_accts,value_accts,territory
   astro,https://MyDomainName.file.force.com/profilephoto/7290M000000WJzg/M/1,829,1309742,North America
   ...