
You are here:
Custom Map Charts
Use a custom map if you have data with a geographical component that doesn't match any of the standard maps provided by CRM Analytics charts, such as custom regions. You can also use custom maps for areas that can be represented with polygons, such as stadium seat sections, city blocks, or floor plans.
Custom map charts can be used in lenses and dashboards. You can create and manage custom maps in lenses and dashboard designer.
Custom map charts in CRM Analytics can be created from GeoJSON with a geometry type of Polygon or MultiPolygon. See the reference section for more information. Data is overlaid on a custom map using either an id or name property as a key.
Create a Custom Map
CRM Analytics comes with prepackaged maps that you can use in map, bubble map, and geo map charts. If you need a map that isn’t available, upload the geoJSON file to the user interface to create it. Set the boundaries to focus on a specific region.
Adding, editing, and deleting custom maps, and uploading geoJSONs requires the Manage CRM Analytics Custom Maps user permission. Users with this permission can edit and delete any custom map, including maps created by other users. All users in the org, even those without this permission, can use all maps in their lenses and dashboards.
-
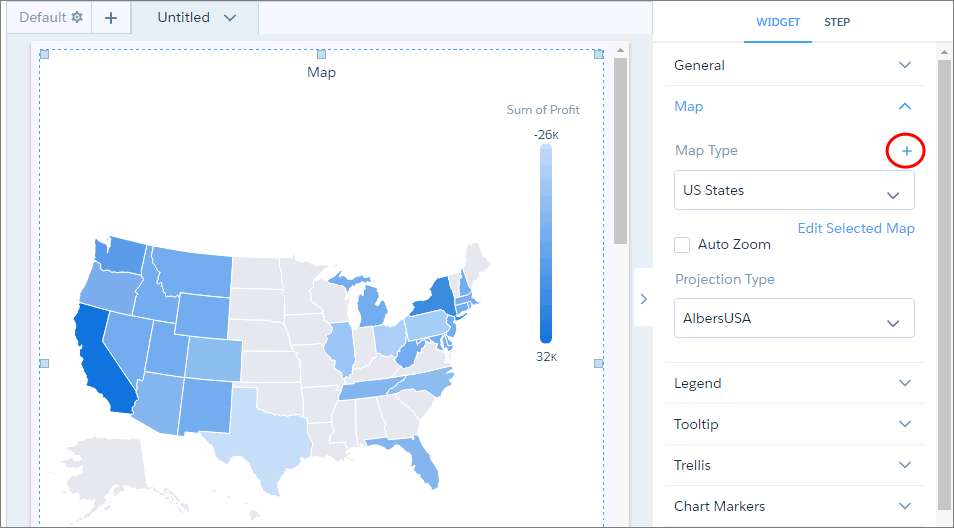
Select the map widget, and click
 next to the
Map Type widget property.
next to the
Map Type widget property.
-
In the left pane, choose an existing geoJSON or upload a new one (max 10 MB). Each map is
based on an underlying geoJSON.
 Tip You can create multiple maps from the same geoJSON by applying unique boundaries that focus on different regions. To edit or delete an existing geoJSON, hover over the geoJSON and click the appropriate button. You can delete only unused geoJSONs, those that aren’t used to define maps. To delete a used geoJSON, first remove it from the maps in which it’s used.
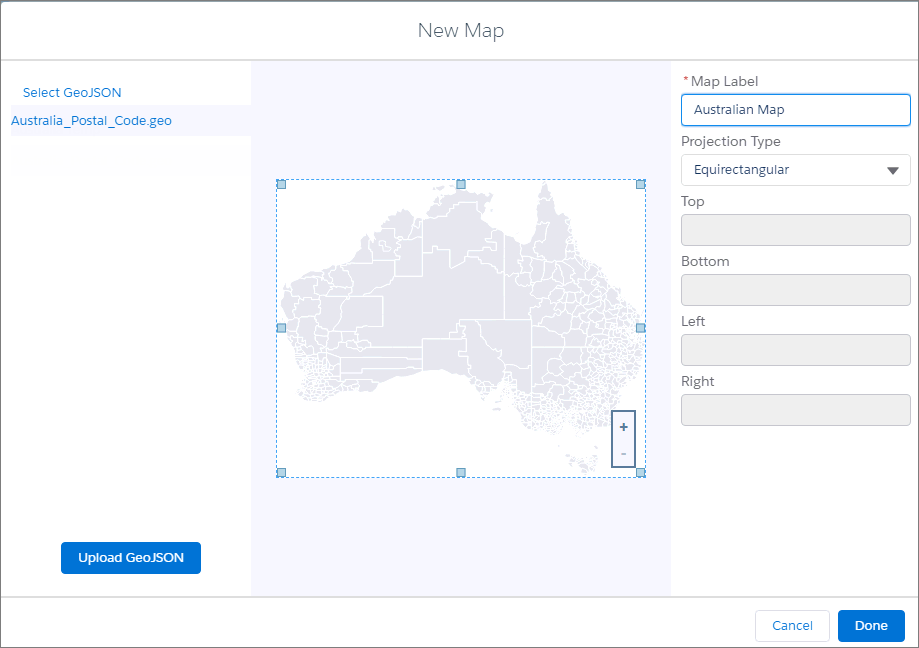
-
Specify the label and projection type of the new map.
Mercator is most suitable for traditional geographical maps. Use AlbersUSA for a map of the United States of America that includes Hawaii and Alaska near the rest of the United States. Use Equirectangular for simple geometric shapes such as floor plans, city blocks, or zip-code areas.
 Note When you use the map in a chart, you can override this projection type in the widget properties.
 -
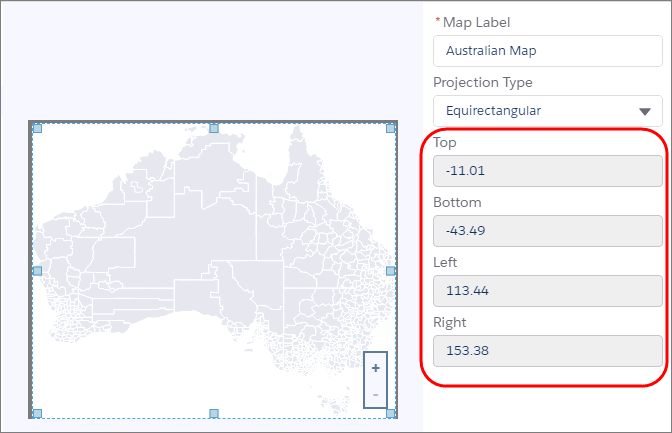
In the center pane, drag the handles of the map to change the boundaries, and zoom in
on a particular region. The boundaries are listed in the right pane.
 Note If your custom map is blank or does not show the expected country or region, your GeoJSON file could be missing the necessary boundary coordinates. We recommend using external tools, such as GeoJSON.io, to accurately generate or verify the geographic features for your map.
Edit and Delete a Custom Map
Edit a map to change its boundaries.
-
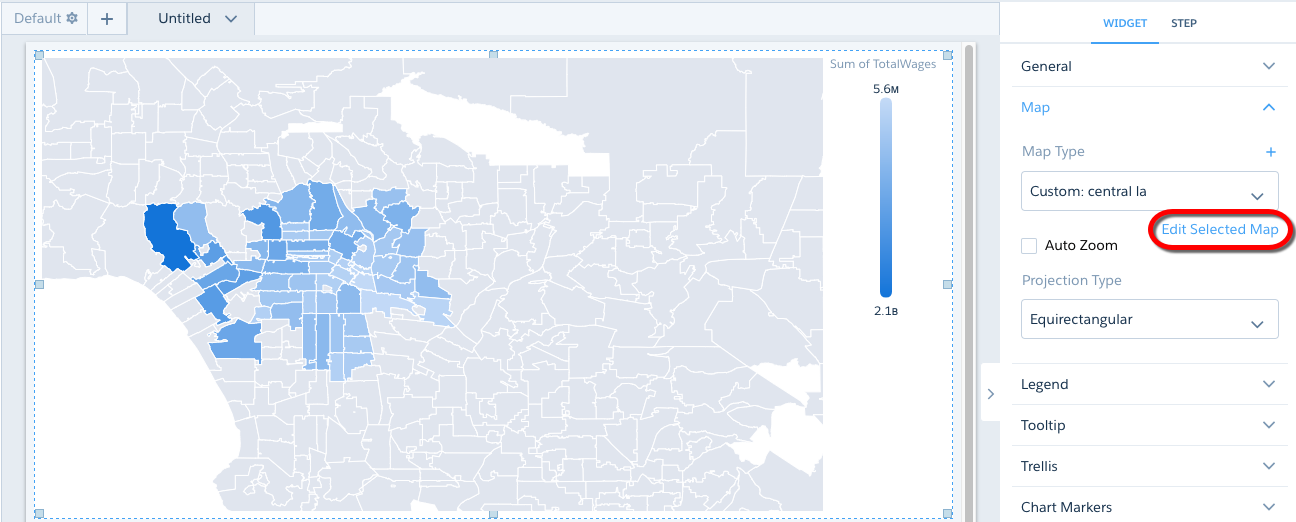
In the Map Type property, select the map type and then click Edit Selected
Map.
-
Drag the handles of the map to change the bound box.
The new coordinates appear in the right pane.
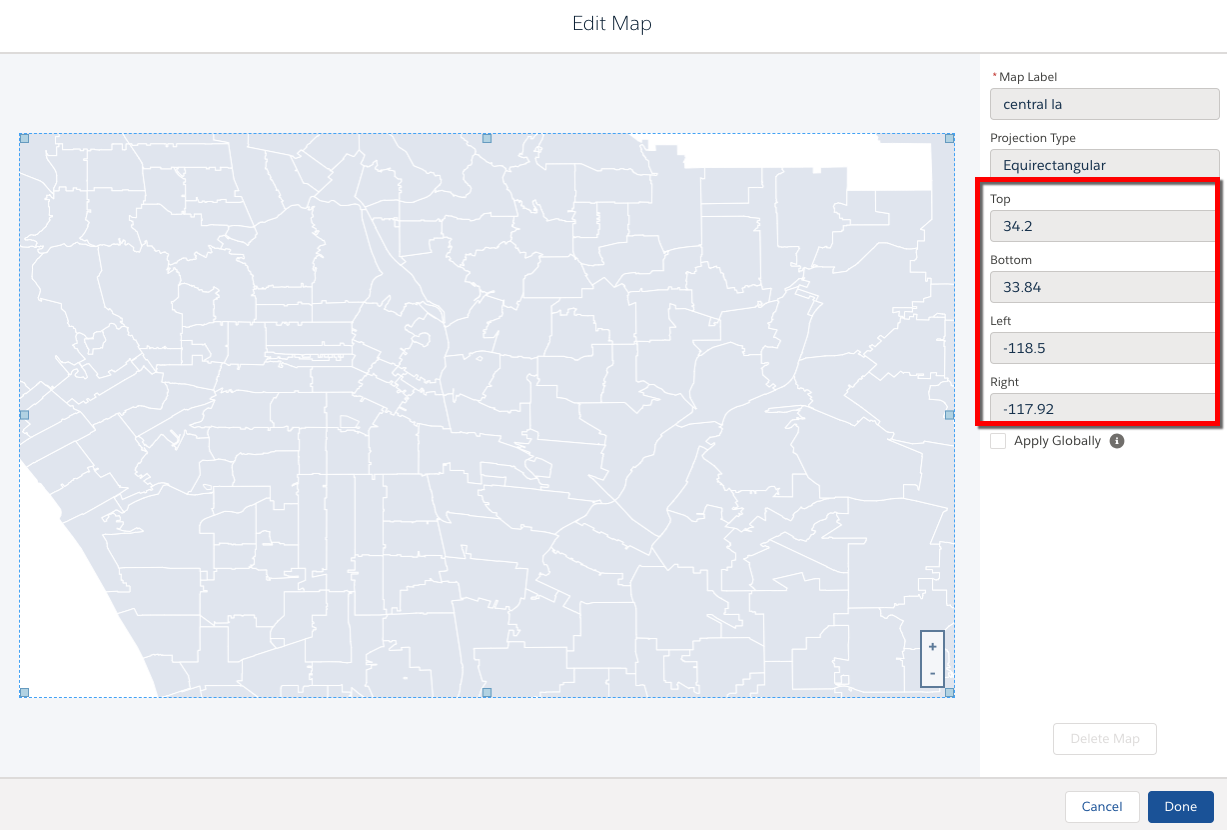
- To apply the changes to all lenses and dashboards in your org that use this map, select Apply Globally. If left unchecked, the changes only apply to this instance of the map.
-
To delete the map, click Delete Map.
You can’t delete maps that are prepackaged with CRM Analytics.
- Click Done.
Properties of Custom Maps
Proper formatting of the underlying GeoJSON is critical for successfully overlaying data onto a custom map. For improved presentation, it may be necessary to adjust the map's bounding-box coordinates to zoom in on the overlaid areas.
GeoJSON Structure
Standard GeoJSON typically has a structure that contains feature blocks similar to the following:
          {
             "type": "Feature",
             "geometry": {
               "type": "MultiPolygon",
               "coordinates": [
                 [125.6, 10.1],
                 [126.1, 11.0], ...
               ]
             },
             "id": "SI",
             "properties": {
               "name": "Sandwich Islands",
               "property1": "value1"
             }
          }
Each feature block defines a shape, or map area. To correctly overlay data onto the map,
the data must have a column with values uniquely matching one of the properties in the
GeoJSON. For example, if the data has values in a column called Country_Code, then each
feature block in the GeoJSON should have a property called "id" with values that exactly
match values in Country_Code. The feature block with "id": "SI" would match a row in the data that has "SI" in the Country_Code
column, and that data can then be overlaid on the area defined by that feature block. To
overlay the data on the matching areas, you'll have to group on Country_Code when
exploring the dataset in Analytics.
The "id" property is required, and it has to be at the same level as "properties" in the GeoJSON. Often, however, it's a child of "properties":
    {
       "type": "Feature",
       "geometry": {
          "type": "MultiPolygon",
          "coordinates": [
             [125.6, 10.1],
             [126.1, 11.0], ...
          ]
       },
       "properties": {
          "name": "Sandwich Islands",
          "id": "SI",
          "property1": "value1"
       }
    }
Sometimes "id" doesn't exist at all, and must be created. In either case, the original GeoJSON must be edited to contain the "id" property at the level of the "properties" property. In a single feature block, doing that is trivial, but a large GeoJSON file could contain hundreds of GeoJSON feature blocks. Using a script is recommended.
Bounding Boxes
You can "zoom" into a map area by redefining the area of the map to display. This is done by giving the boundaries of the new area in terms of coordinates. These coordinates are called a bounding box. A bounding box limits the map to the shapes within the coordinates, or borders, of the bounding box.
When you create a map from a GeoJSON without a bounding box, every defined shape is displayed as an area on the map. For example, the following map of zip codes in the Los Angeles area does not use a bounding box:
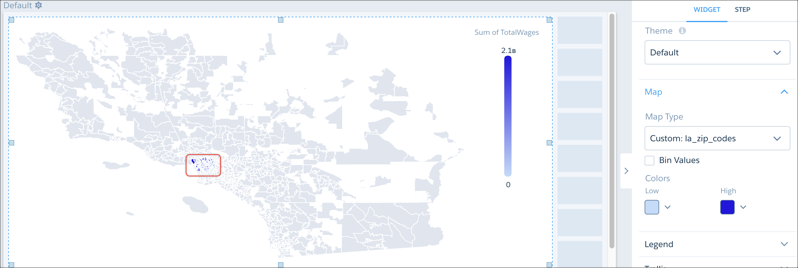
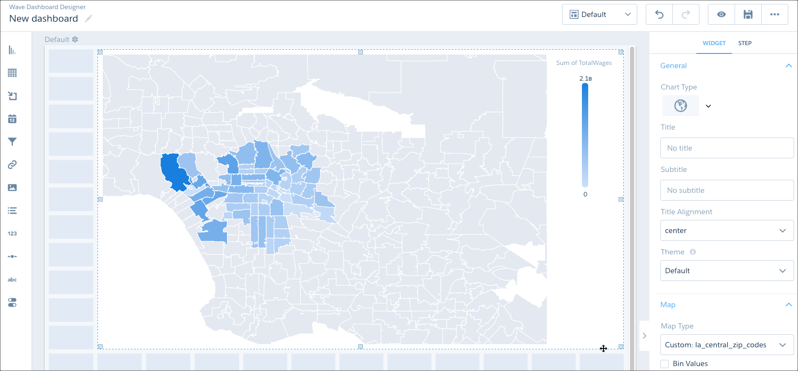
The areas of interest, where data has been overlaid on the map, are indicated by the red rectangle. To make the map more readable, the view should zoom in on the zip-code areas that have data. The coordinates (in this case, latitude and longitude) bordering the area of interest can be found using a GeoJSON tool that gives the coordinates of the areas in the map. A second map is then created from the original GeoJSON, this time with bounding-box coordinates.
When viewed in Analytics, this new map is zoomed in on the area of interest.
You can set the bounding box while creating or editing a map.