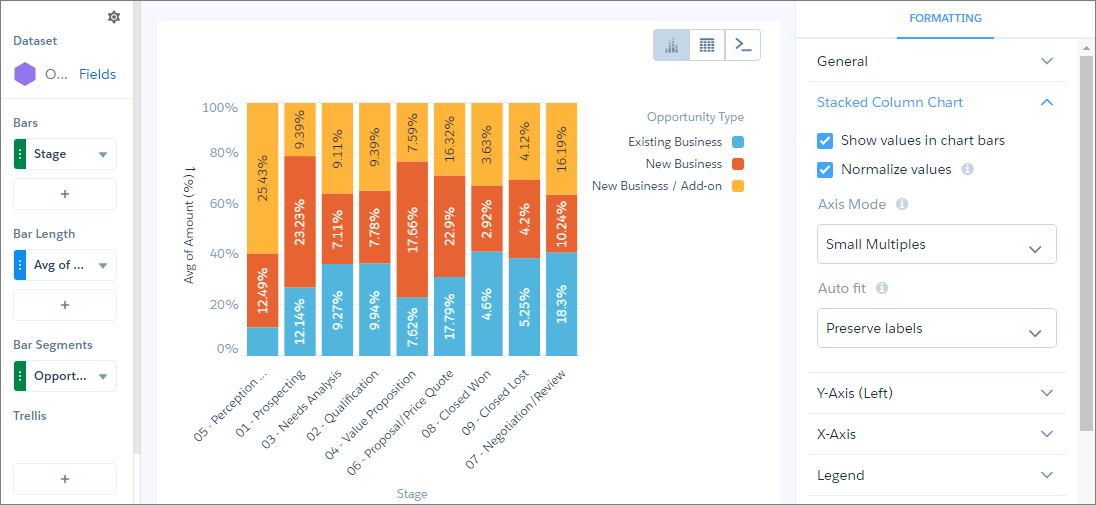
Use a column chart (also called vertical bar chart) to show relative counts of things,
such as leads or dollars. Use a stacked column chart to show groups within each bar.
Did this article solve your issue?
Let us know so we can improve!
Loading
Salesforce Help | Article
Cookie Consent Manager
General Information
Required Cookies
Functional Cookies
Advertising Cookies
General Information
We use three kinds of cookies on our websites: required, functional, and advertising. You can choose whether functional and advertising cookies apply. Click on the different cookie categories to find out more about each category and to change the default settings.
Privacy Statement
Required Cookies
Always Active
Required cookies are necessary for basic website functionality. Some examples include: session cookies needed to transmit the website, authentication cookies, and security cookies.
Functional Cookies
Functional cookies enhance functions, performance, and services on the website. Some examples include: cookies used to analyze site traffic, cookies used for market research, and cookies used to display advertising that is not directed to a particular individual.
Advertising Cookies
Advertising cookies track activity across websites in order to understand a viewer’s interests, and direct them specific marketing. Some examples include: cookies used for remarketing, or interest-based advertising.