
You are here:
Add Lightning Reports to Your Dashboards with Direct Report Queries
Unify your analytics by incorporating tabular, summary, aggregate, and matrix reports in your CRM Analytics dashboards for a single and consistent experience.
By adding Lightning reports to your dashboards, you can apply CRM Analytics functionalities to visualize report insights in different ways. You can learn more about Lightning reports in Salesforce Help.
Add Lightning reports to a CRM Analytics dashboard
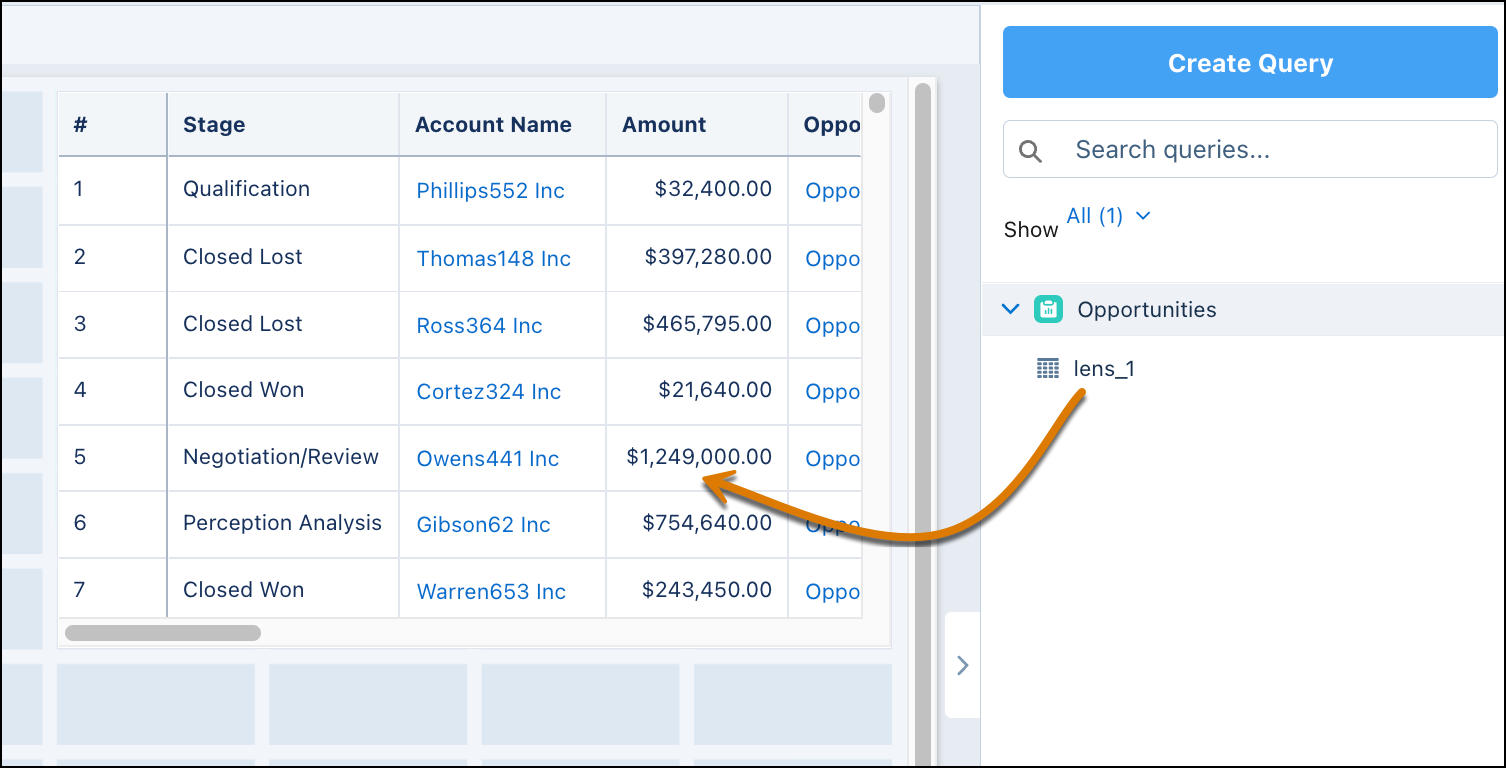
- With a dashboard open in edit mode, click Create Query.
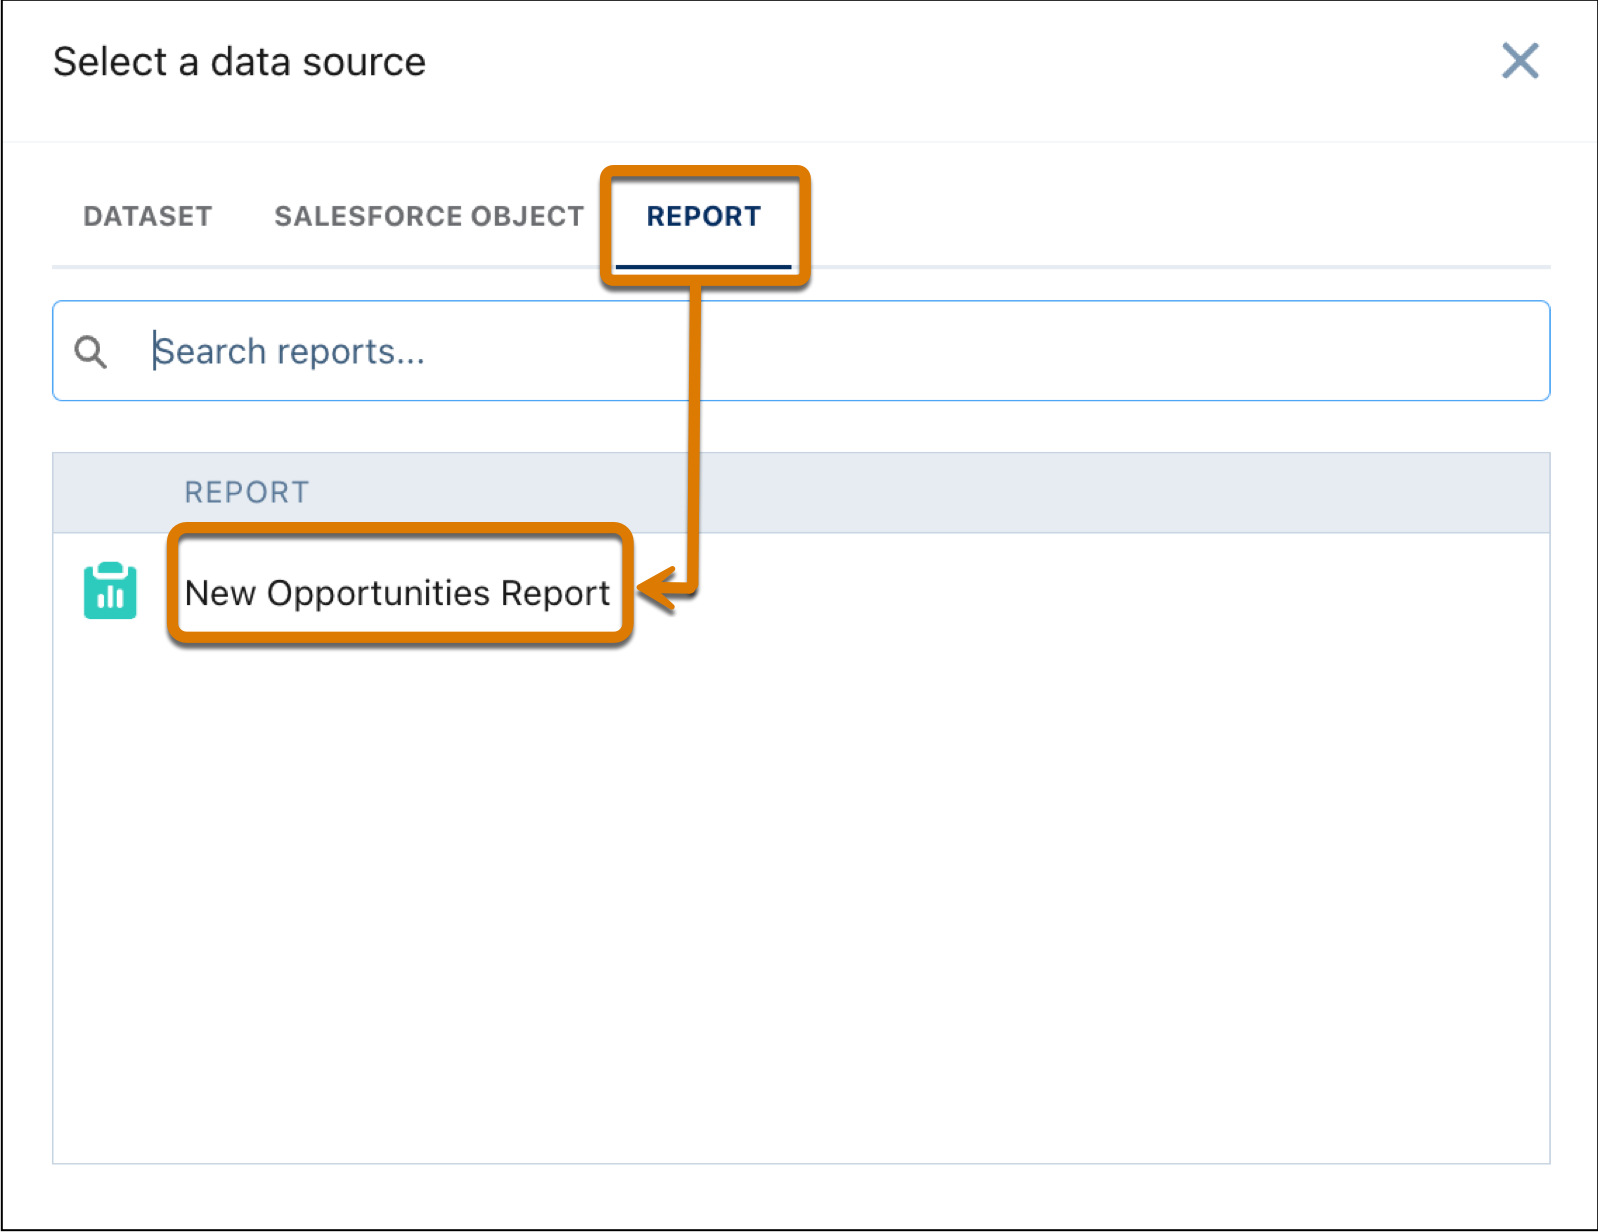
- Click the Report tab to see available reports.
- Choose a report.
- Add a widget to your dashboard, such as a table widget.
- Drag the Lightning report query you created onto the widget in the
dashboard.
- Select the widget and then click the Query tab to control how report data is displayed in the widget.
- Choose a view option in the View As dropdown.
- Aggregate—Hides details; individual records don’t display in the report.
- Grouping—summary formulas, and record counts remain visible (tabular format).
- Summary—Shows data in a combined chart and table format. Reports must be grouped by rows (summary report).
When you create a CRM Analytics query from a report, the query is created based on the currently saved version of the report. To edit groupings and fields in a report that’s used in a CRM Analytics dashboard, modify the report using report builder, save the report, and then refresh the dashboard in CRM Analytics.