
You are here:
Dynamically Set Initial Selections Based on the Dashboard Viewer
You can set initial filter selections to show information that’s relevant to the logged in user. For example, you can filter a sales dashboard such that each sales rep views only their sales opportunities and performance. You can set initial filter selections based on the user ID, user name, role ID, or role name of the logged in user.
You can set initial selections based on the following Salesforce user tokens: user.id, user.name, user.rolename, and
user.roleid. At runtime, CRM Analytics
retrieves the values of these tokens from Salesforce environment
variables—these values don’t come from datasets.
When the dashboard opens, you want it to dynamically filter charts based on the name of the currently logged in user.
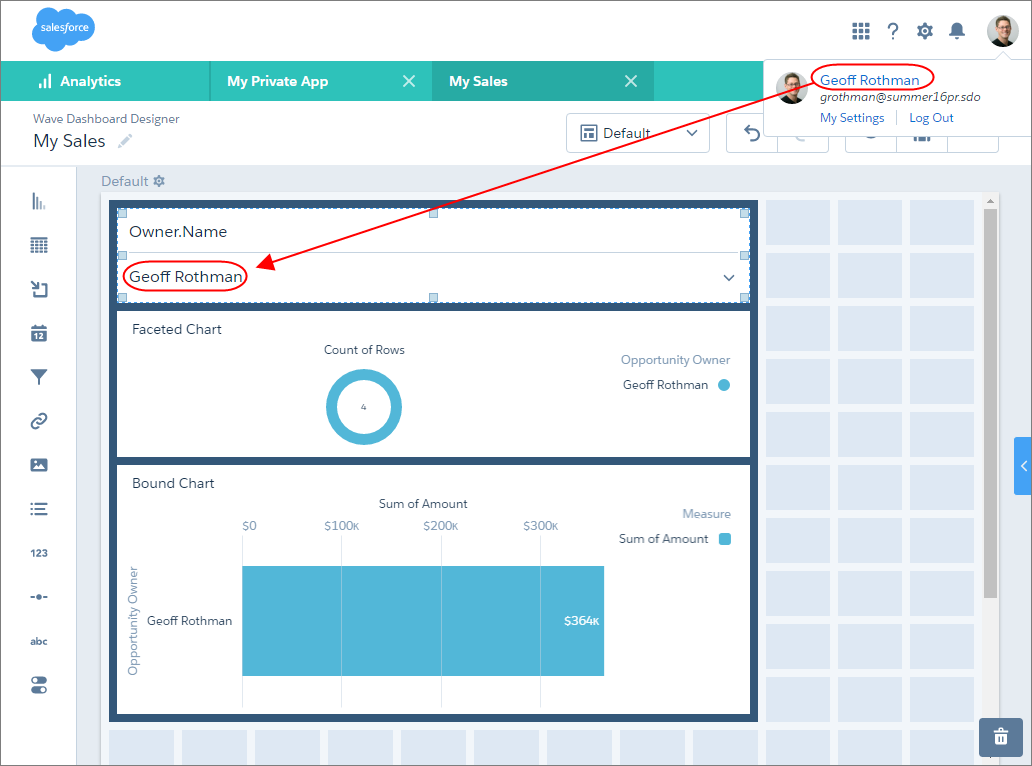
To add the filter, create a list widget and then, in the dashboard JSON, add an
initial filter selection based on the user.name
token in the widget’s query (Owner_Name_1).
This selection filters the following charts:
- Donut chart because its query (
Owner_Name_3) is faceted with queryOwner_Name_1. - Bar chart because its query (
Owner_Username_3) contains a binding based on queryOwner_Name_1.
See the bold text in the following dashboard JSON to see how to set the initial filter, as well as facet and bind the queries.
{
    "label": "My Sales",
    "state": {
        "gridLayouts": [
        …
        ],
        "layouts": [],
        "steps": {
            "Owner_Name_1": {
                "datasets": [
                    {
                        "id": "0FbB00000000pNNKAY",
                        "label": "Opportunities",
                        "name": "opportunity",
                        "url": "/services/data/v38.0/wave/datasets/0FbB00000000pNNKAY"
                    }
                ],
                "isFacet": true,
                "isGlobal": false,
                "query": {
                    "measures": [
                        [
                            "count",
                            "*"
                        ]
                    ],
                    "groups": [
                        "Owner.Name"
                    ]
                },
                "selectMode": "multi",
                "start": [
                    "!{User.Name}"
                ],
                "type": "aggregateflex",
                "useGlobal": false,
                "visualizationParameters": {
                    "options": {}
                }
            },
            "Owner_Name_3": {
                "datasets": [
                    {
                        "id": "0FbB00000000pNNKAY",
                        "label": "Opportunities",
                        "name": "opportunity",
                        "url": "/services/data/v38.0/wave/datasets/0FbB00000000pNNKAY"
                    }
                ],
                "isFacet": true,
                "isGlobal": false,
                "query": {
                    "measures": [
                        [
                            "count",
                            "*"
                        ]
                    ],
                    "groups": [
                        "Owner.Name"
                    ],
                    "order": [
                        [
                            -1,
                            {
                                "ascending": false
                            }
                        ]
                    ]
                },
                "selectMode": "single",
                "type": "aggregateflex",
                "useGlobal": true,
                "visualizationParameters": {
                    "visualizationType": "hbar",
                    "options": {}
                }
            },
            "Owner_Username_3": {
                "datasets": [
                    {
                        "id": "0FbB00000000pNNKAY",
                        "label": "Opportunities",
                        "name": "opportunity",
                        "url": "/services/data/v38.0/wave/datasets/0FbB00000000pNNKAY"
                    }
                ],
                "isFacet": false,
                "isGlobal": false,
                "query": {
                    "measures": [
                        [
                            "sum",
                            "Amount"
                        ]
                    ],
                    "groups": [
                        "Owner.Name"
                    ],
                    "filters": [
                        [
                            "Owner.Name",
                            "{{column(Owner_Name_1.selection, [\"Owner.Name\"]).asObject()}}",
                            "in"
                        ]
                    ],
                    "order": [
                        [
                            -1,
                            {
                                "ascending": false
                            }
                        ]
                    ]
                },
                "selectMode": "multi",
                "type": "aggregateflex",
                "useGlobal": true,
                "visualizationParameters": {
                    "visualizationType": "hbar",
                    "options": {}
                }
            }
        },
        "widgetStyle": {
            "backgroundColor": "#FFFFFF",
            "borderColor": "#E6ECF2",
            "borderEdges": [],
            "borderRadius": 0,
            "borderWidth": 1
        },
        "widgets": {
            "listselector_2": {
                "parameters": {
                    "compact": false,
                    "expanded": true,
                    "exploreLink": false,
                    "instant": true,
                    "measureField": "count",
                    "step": "Owner_Name_1",
                    "title": "Owner.Name"
                },
                "type": "listselector"
            },
            "chart_2": {
                "parameters": {
                    "autoFitMode": "fit",
                    "showValues": true,
                    "legend": {
                        "showHeader": true,
                        "show": true,
                        "position": "right-top",
                        "inside": false
                    },
                    "axisMode": "sync",
                    "visualizationType": "hbar",
                    "exploreLink": true,
                    "title": {
                        "label": "Bound Chart",
                        "align": "left",
                        "subtitleLabel": ""
                    },
                    "trellis": {
                        "enable": false,
                        "type": "x",
                        "chartsPerLine": 4
                    },
                    "measureAxis2": {
                        "showTitle": true,
                        "showAxis": true,
                        "title": ""
                    },
                    "measureAxis1": {
                        "showTitle": true,
                        "showAxis": true,
                        "title": ""
                    },
                    "theme": "wave",
                    "step": "Owner_Username_3",
                    "dimensionAxis": {
                        "showTitle": true,
                        "showAxis": true,
                        "title": ""
                    }
                },
                "type": "chart"
            },
            "chart_4": {
                "parameters": {
                    "visualizationType": "pie",
                    "exploreLink": true,
                    "title": {
                        "label": "Faceted Chart",
                        "align": "left",
                        "subtitleLabel": ""
                    },
                    "step": "Owner_Name_3",
                    "theme": "wave",
                    "legend": {
                        "show": true,
                        "showHeader": true,
                        "inside": false,
                        "position": "right-top"
                    },
                    "trellis": {
                        "enable": false,
                        "type": "x",
                        "chartsPerLine": 4
                    },
                    "showMeasureTitle": true,
                    "showTotal": true,
                    "inner": 70
                },
                "type": "chart"
            },
            "container_1": {
                "type": "container",
                "parameters": {
                    "documentId": "",
                    "fit": "original",
                    "alignmentX": "left",
                    "alignmentY": "top"
                }
            }
        }
    },
    "datasets": [
        {
            "id": "0FbB00000000pNNKAY",
            "label": "Opportunities",
            "name": "opportunity",
            "url": "/services/data/v38.0/wave/datasets/0FbB00000000pNNKAY"
        }
    ]
}
For information about editing the dashboard JSON, see the CRM Analytics Dashboard JSON Developer Guide .