
You are here:
Create a Query with a Lens
Manually create a query from the dashboard designer when you’re concerned about the results it returns and not the widget that displays those results. For example, you might build a query that calculates three measures. You can display all measures in a combo chart and display each measure in a separate number widget as well. You can reuse queries in multiple widgets.
For information about clipping a lens to create a query, see Clip a Lens to a Dashboard.
- To open the queries panel, click an empty space in the dashboard canvas in the dashboard designer.
-
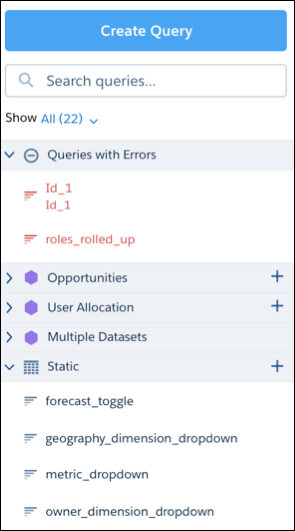
If the queries panel has existing queries organized in sections, click
 next to the a section to
create a query of that type.
For example, click next to the Static section to create a custom query. This
feature is available for all section types, except
next to the a section to
create a query of that type.
For example, click next to the Static section to create a custom query. This
feature is available for all section types, except Apex,Soql, and multiple-dataset queries. -
Click Create Query.
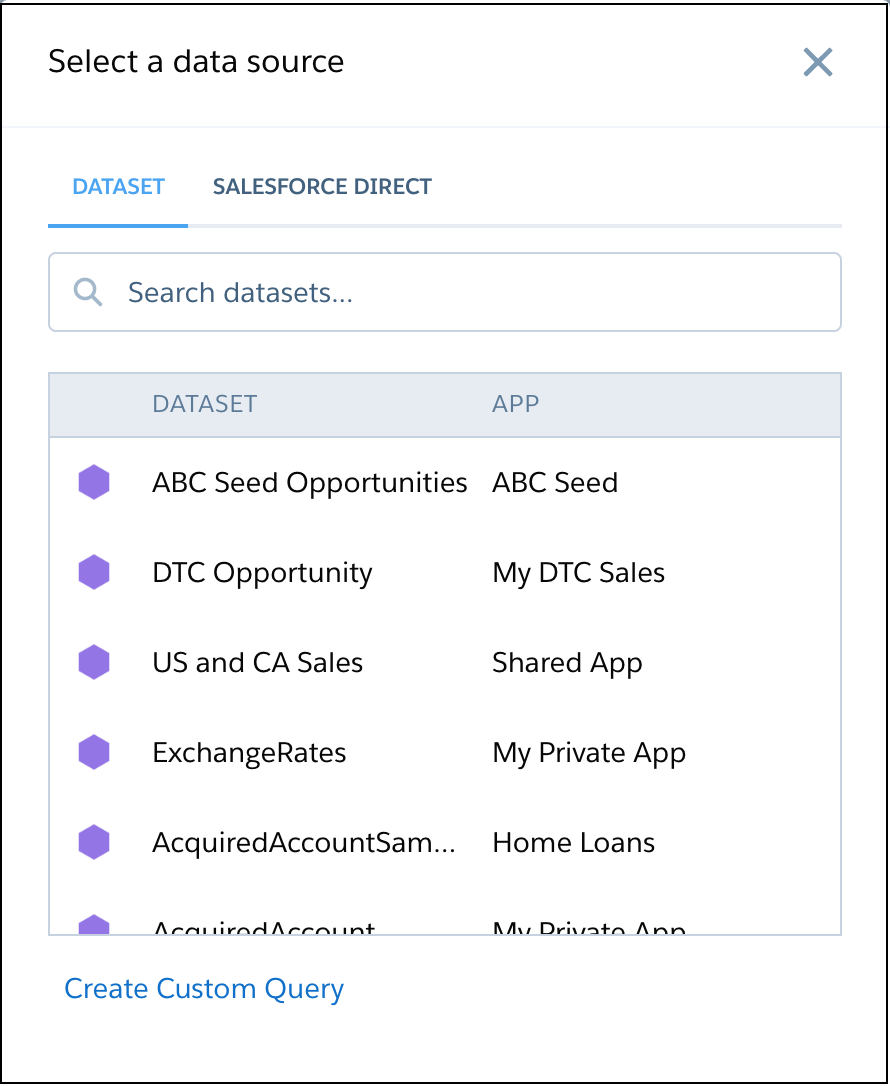
- Click Dataset for a CRM Analytics dataset or Salesforce Direct for a Salesforce object.
-
Select the dataset or Salesforce object that contains the data
that you want to include in the query. Enter the name in the search box if your data
source isn’t easy to find.
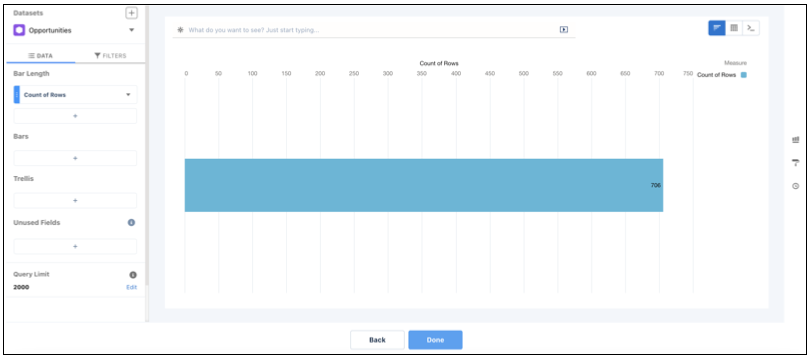
The lens appears showing the default measure, Count of Rows.
-
In the lens, click Untitled Query and
enter the query label.
CRM Analytics creates the query ID from the label. After you create the query, you can’t change the query ID. CRM Analytics refers to queries by their ID so dashboards don’t break if you change the labels.
-
To add a measure, click + under the Bar
Length field.
The Count of Rows measure shows, by default. To change a measure, click the measure and then choose a new one.You can add as many measures as needed.
-
To group the measures by a date or dimension, click
+ under Bars, and then select the field.
You can add multiple groupings. To change a grouping, click the grouping and select a new field. To reorder or delete a grouping, click the down arrow to the right of the grouping and then select the option.
-
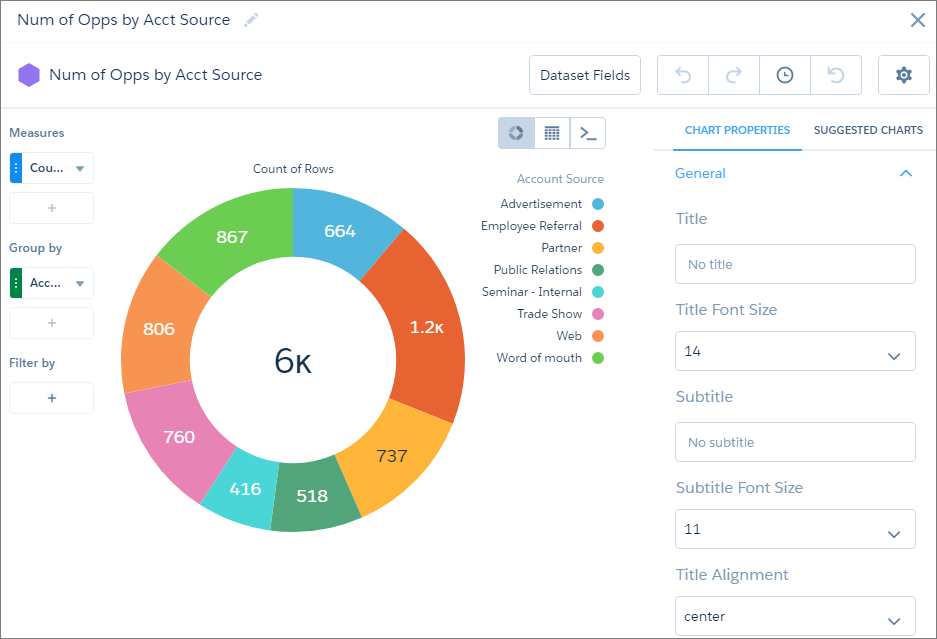
To add a filter, select Filters, click
+ under Filters, and then select the field to filter by.
You can add multiple filters.
-
To change the chart or table type for the query, click
 or
or  ,
respectively.
,
respectively.
-
To set the widget properties at the query-level, click
 .
.
-
To write a custom SAQL or SOQL query, click
 .
For more information, see Create a Query with the Query Editor.
.
For more information, see Create a Query with the Query Editor. -
Click Done.
CRM Analytics adds the query to the query panel, making it available for use by other widgets in the dashboard.
 Tip If you drag the query to the dashboard designer canvas, CRM Analytics displays the query results as the chart specified while creating the query. To display the widget differently in the dashboard than what was specified at the query level, select the widget in the dashboard and then set the widget properties. The widget properties override the query settings.
 - Save the dashboard.
- Tips for Salesforce Direct Data Queries
Direct Data is an option for querying live Salesforce data without having to set up replication or create datasets. With Direct Data, you can query Salesforce objects in the dashboard designer’s explorer and edit Salesforce Object Query Language (SOQL) queries in the query editor.
Did this article solve your issue?
Let us know so we can improve!