
You are here:
Optimize a Query
Queries can slow down your dashboard. Run a performance check on the queries to ensure that they’re running optimally. CRM Analytics identifies query bottlenecks and provides recommendations to improve query performance.
-
Open the dashboard in view mode.
Because CRM Analytics analyzes query performance for the current layout only, ensure that you’re viewing the dashboard in the right layout. Performance can differ from one layout to another because layouts can have different widgets and interactions. If the dashboard contains multiple pages, CRM Analytics provides performance analysis for the current page.
-
Click the drop-down arrow for the widget that uses the query that you want to analyze.
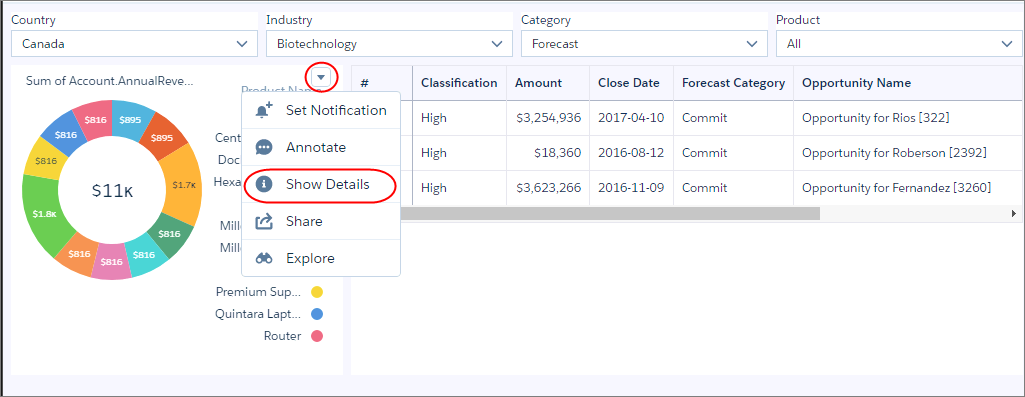
-
Select Show Details for the
widget.
The query details summarize different parts of the query, like measures, filters, groupings, and the dataset on which its built.
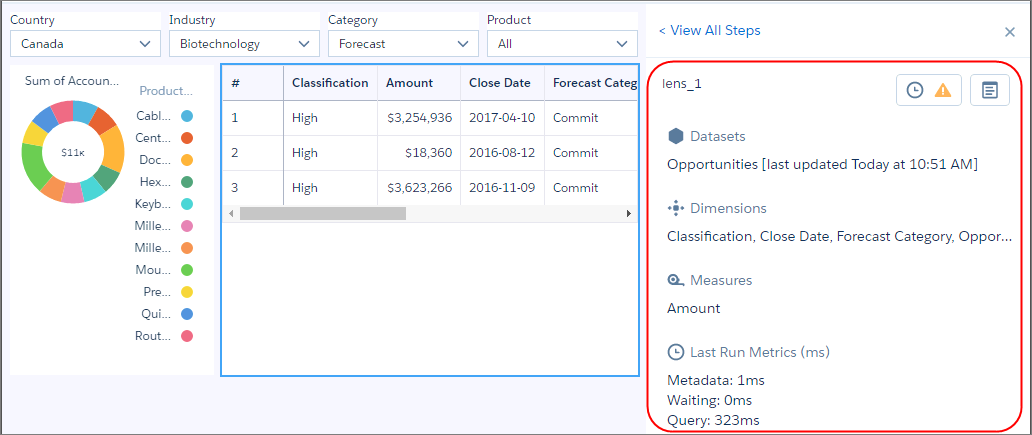
The Last Run Metrics section identifies other factors that contribute to the total time required to populate the results of a query.
Last Run Metric Description Metadata Number of milliseconds needed to retrieve the metadata for the datasets involved in the query. The metadata fetch only occurs the first time the query runs. Waiting Number of milliseconds needed to resolve bindings to construct the query. Query Number of milliseconds to run the query. Note that a run might execute the query or use cached results. If CRM Analytics identifies a performance issue with the query, it shows a warning icon (
 ) next to the View Performance Details button (
 ), as the previous screenshot shows.
 -
To view the performance issues and suggestions for resolving them, click .
The Performance Factors section shows all factors by which the query is evaluated. Ignore the factors with a green checkmark (
 ) because these issues don’t apply to the query.
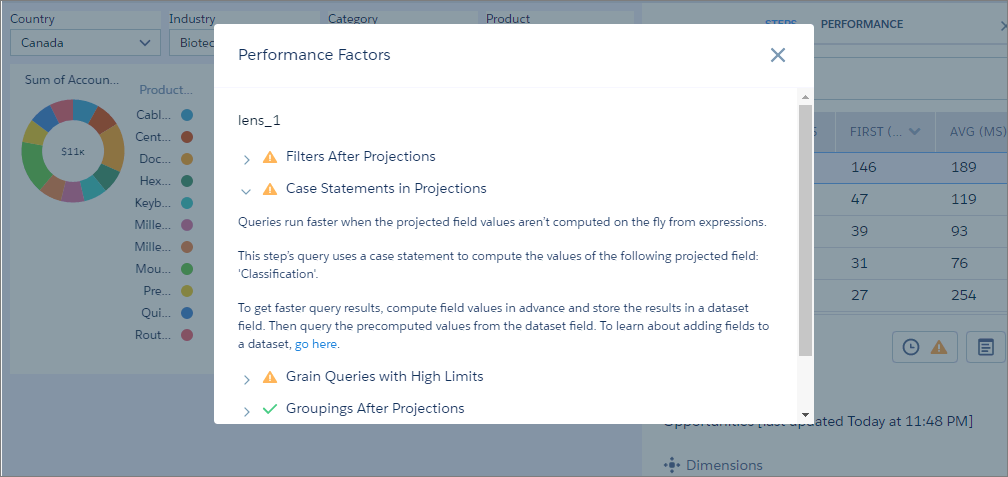
- Expand each factor with a warning icon to learn how to improve the query’s performance.