
You are here:
Add a Range Widget to Filter Dashboard Results Based on a Measure
A range widget allows dashboard viewers to filter the CRM Analytics dashboard results based on a range of values for a measure. For example, a range widget can show only opportunities with amounts between $100,000 and $900,000.
The range widget requires a query that has a single measure and no groupings.
- Drag the range widget to the dashboard canvas.
-
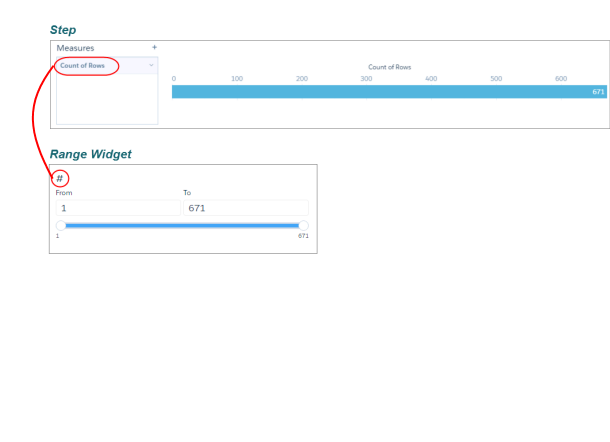
To open the wizard, click the button inside the
widget.
The Select a Field screen appears, showing a list of all measure fields in the specified dataset.
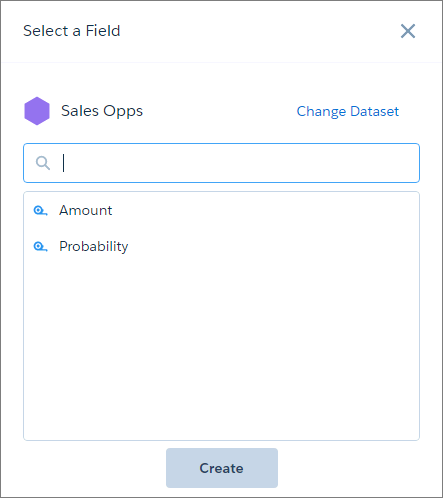
- To use a different dataset, click Change Dataset.
- Select the date field that you want to filter on by selecting it from the field list or typing in its API name.
-
Click Create.
Behind the scenes, CRM Analytics creates a query with the measure that you selected. CRM Analytics adds the query to the query panel, but you can’t reuse it in other widgets. CRM Analytics doesn’t apply any selections to the widget.
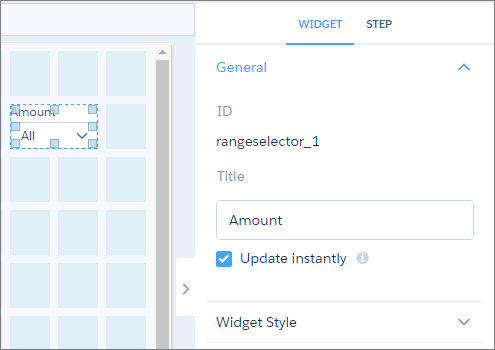
-
To change the widget and query properties, select the
widget.
The Widget panel groups the widget properties into sections. So that you don’t accidentally overlook any properties, expand any collapsed sections.
-
To customize the appearance of the widget, set the widget
properties.
When you set a property, the widget immediately shows the effects of your change.
-
To show and set the query properties, click
Query in the right panel.
For example, to enable this widget to filter other faceted widgets, select Broadcast selections as facets.
-
To preview your changes to the dashboard, click the Preview
button.
The default range shown is the minimum to the maximum values of the measure.
- Save the dashboard.
You can set an initial selection that applies when the dashboard opens. The selected range filters other faceted widgets. While viewing the dashboard, viewers can change the selection to filter the results differently. For information about setting an initial selection, see Set Initial Selections in the Dashboard.