You are here:
Add Number Widgets to Include Key Metrics
Key metrics help you track critical measurements of your business. For example, you can show the total number of open cases or total opportunity amount for the last quarter or the northern region.
The number widget requires a query that has at least one measure. If the query has multiple measures, you can choose which measure to display in the widget properties—by default, the first measure shows. If you include groupings, the widget displays the measure for the first group.
- Drag the number widget to the dashboard canvas.
-
One of the following screens appears.
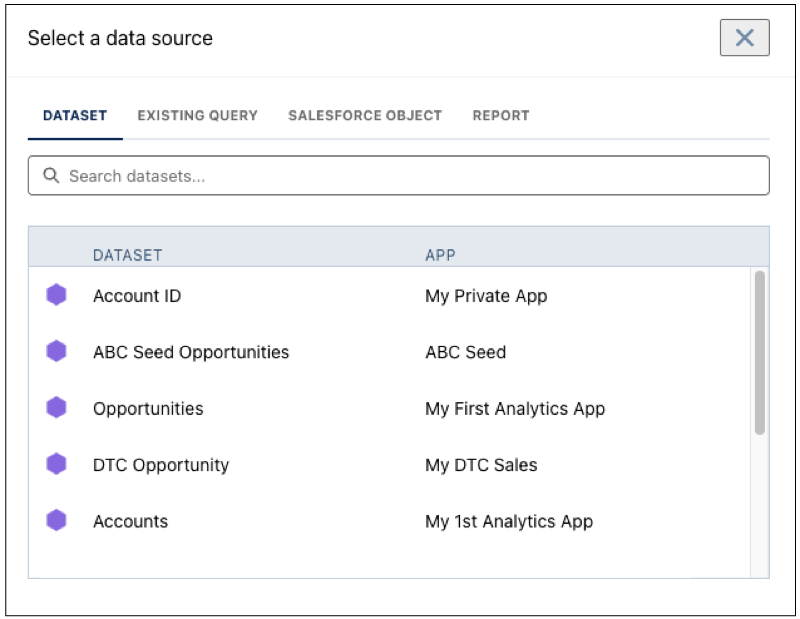
- The Choose Data screen appears, showing the most recently used datasets first.
Select the dataset in the Create Query tab or select an existing query in the
Use
Existing Query tab.
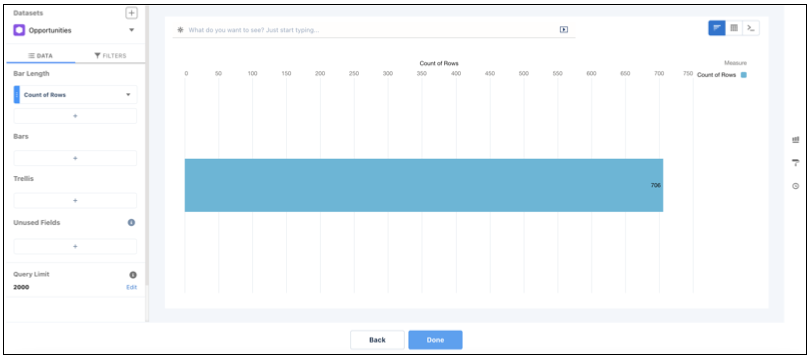
- The lens appears, showing a bar chart with the Count of Rows measure. CRM Analytics
selects the dataset that you used to create the previous query. To use a different
dataset or an existing query, click Back.
- The Choose Data screen appears, showing the most recently used datasets first.
Select the dataset in the Create Query tab or select an existing query in the
Use
Existing Query tab.
- In the lens, click Untitled Query and enter the query label.
- To add a measure, click + under the Bar Length field.
-
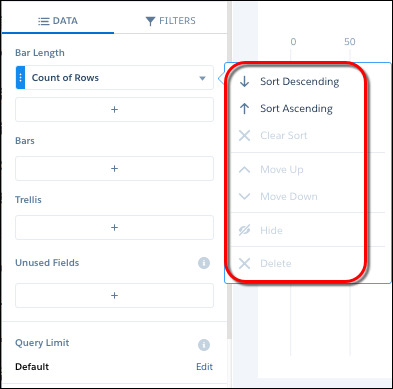
To sort, reorder, or delete a measure, click the
down arrow to the right of the measure and select the option.
Alternatively, to quick sort on a measure, click the measure’s field header. Quick sort isn’t available for charts with these underlying queries:
- When the compact-form query has interactions present on the sort order
- When the SAQL query contains union statements or interactions
- When the query is in PIGQL
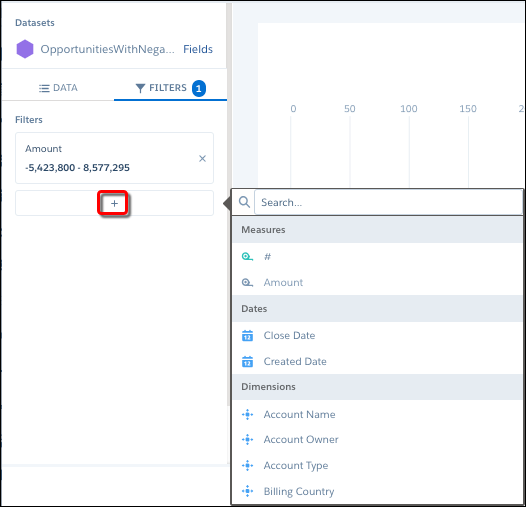
- To add a filter, select Filters, click + under Filters, and then select the field to filter by.
-
To delete the filter, click
 .
.
- Click Done.
-
To change the widget and query properties, select the
widget.
The Widget panel groups the widget properties into sections. So that you don’t accidentally overlook any properties, expand any collapsed sections.
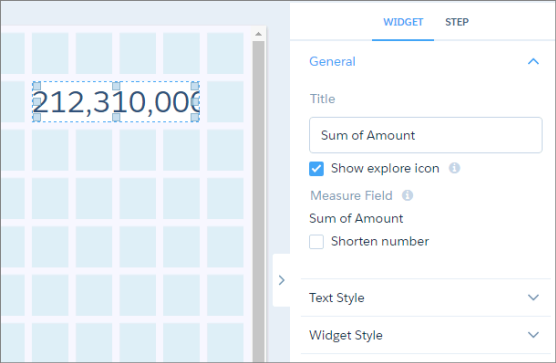
For example, to shorten the number that appears in the widget, select Shorten number in the widget properties. Check out the unit symbols for shortened numbers.
Symbol Unit Example K Thousand (10^3) 4K = 4,000 M Million (10^6) 4M = 4,000,000 B Billion (10^9) 4B = 4,000,000,000 T Trillion (10^12) 4T = 4,000,000,000,000 P Quadrillion (10^15) 4P = 4,000,000,000,000,000 X Quintillion (10^18) 4X= 4,000,000,000,000,000,000 Z Sextillion (10^21) 4Z = 4,000,000,000,000,000,000,000 Y Septillion (10^24) 4Y = 4,000,000,000,000,000,000,000,000 m Thousandth (10^-3) 4m = 0.004 μ Millionth (10^-6) 4μ = 0.000004 n Billionth (10^-9) 4n = 0.000000004 p Trillionth (10^-12) 4p = 0.000000000004 f Quadrillionth (10^-15) 4f = 0.000000000000004 a Quintillionth (10^-18) 4a = 0.000000000000000004 z Sextillionth (10^-21) 4z = 0.000000000000000000004 y Septillionth (10^-24) 4y = 0.000000000000000000000004 -
To customize the appearance of the widget, set the widget
properties.
When you set a property, the widget immediately shows the effects of your change.
- To show and set the query properties, click Query in the right panel.
- To preview your changes to the dashboard, click the Preview button.
- Save the dashboard.