
You are here:
Optimize Dashboard Performance
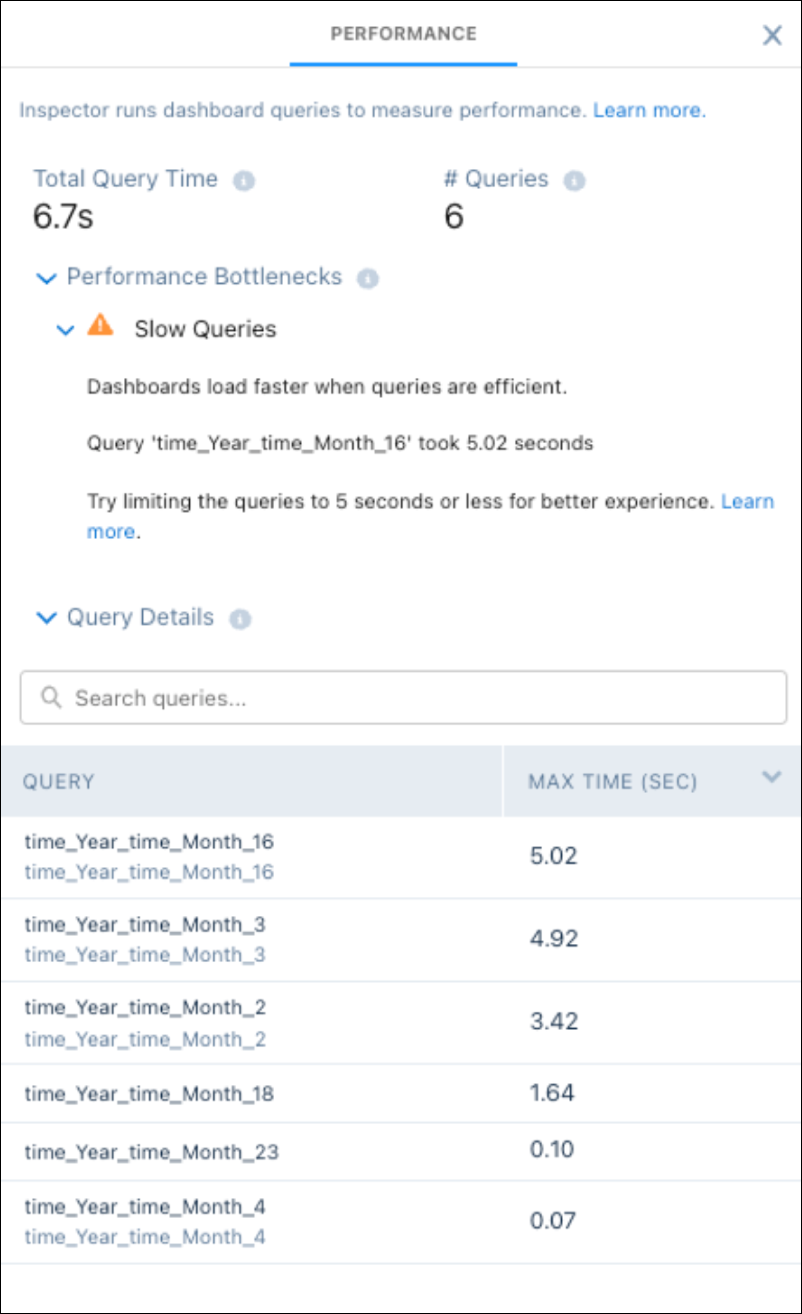
Before you finalize the dashboard, run a performance check on the dashboard and its queries to ensure that everything is running optimally. The dashboard inspector identifies different types of bottlenecks, such as slow queries and networks, and provides recommendations to improve performance. Because dashboard layouts can contain different widgets (and queries), run the inspector on each layout. If a dashboard contains multiple pages, you can run the inspector for all pages. The inspector initially provides results only for the current page.
- While browsing the app, open a dashboard in view mode.The dashboard inspector is not available while running the app, editing the dashboard, or previewing an embedded dashboard outside of CRM Analytics.
- To open the dashboard inspector, click
 and
then Dashboard Inspector. The dashboard inspector immediately
collects performance metrics.
and
then Dashboard Inspector. The dashboard inspector immediately
collects performance metrics. - The Performance tab shows all factors by which the dashboard is evaluated.
 Note If your dashboard contains multiple pages, the dashboard inspector shows results for the current page being viewed.
 - If a warning icon (
 ) appears next to a factor, expand the factor to learn how to fix
the issue to improve the dashboard’s performance.Ignore the factors with a green checkmark (
) appears next to a factor, expand the factor to learn how to fix
the issue to improve the dashboard’s performance.Ignore the factors with a green checkmark ( )
because these issues don’t apply to the dashboard.
)
because these issues don’t apply to the dashboard. - To analyze the performance of all queries in the dashboard, go to the Query table in
the tab.
The table lists all queries that ran when the dashboard loaded. If the dashboard contains multiple pages, the table lists the queries that ran for the current page. Each time you switch pages, newly run queries are added to the table, and previously run queries, which are no longer used, are listed as unused.
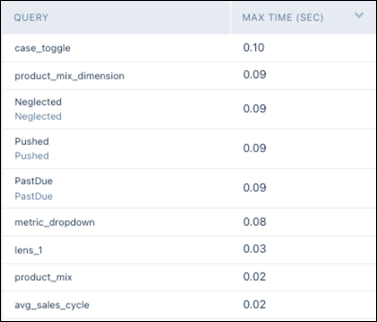
The table shows the following metrics for each query.
Metric Description Max Time (SEC) Maximum execution time for each query on the current dashboard page. - Select a query in the table to view additional details about the query and the last
run.
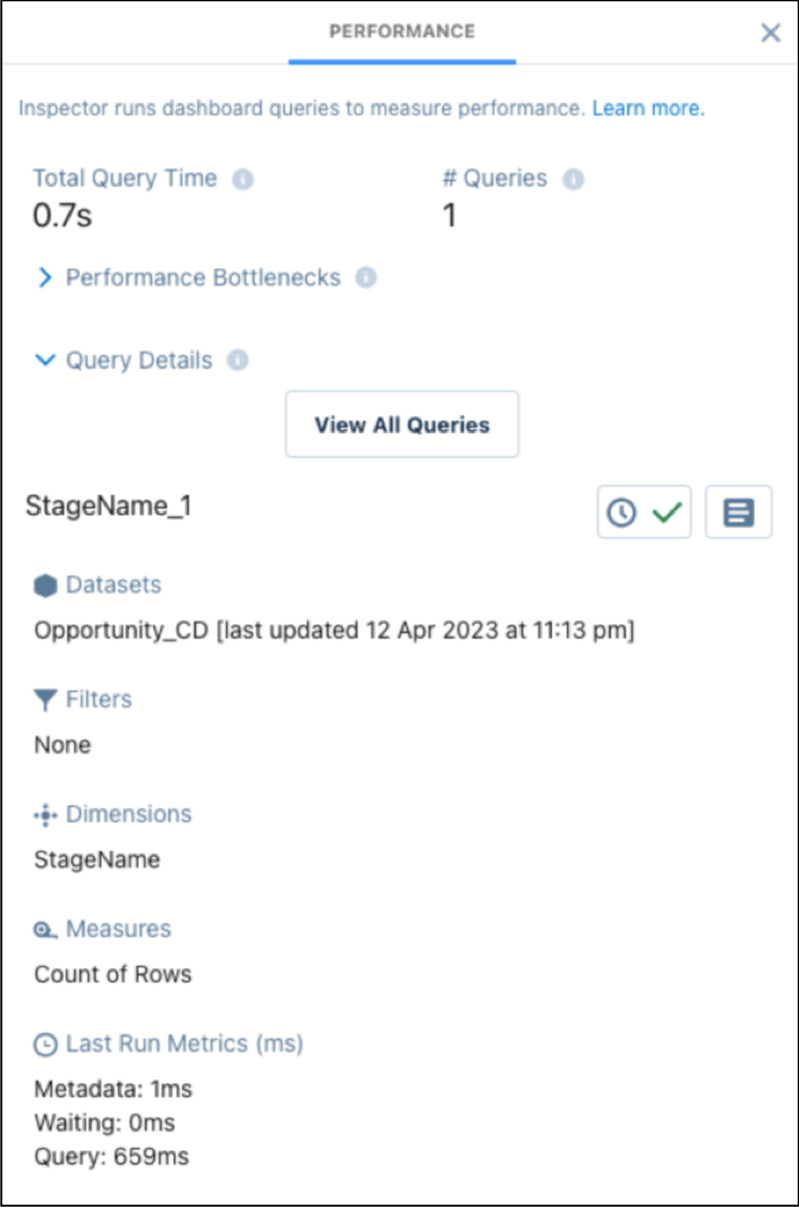
For more information about query performance, see Optimize a Query.
Note When a query has errors and fails to execute, open the Dashboard Inspector and select the query with errors. Use the View More Details button for more information about bindings syntax errors, query level errors, and the query that was run.