
You are here:
Build Queries with Direct Data for Data 360
After you complete setup, CRM Analytics Direct Data for Data 360 lets you create and run queries on Data 360 records in real time. You can also build dashboard charts and tables based on these queries.
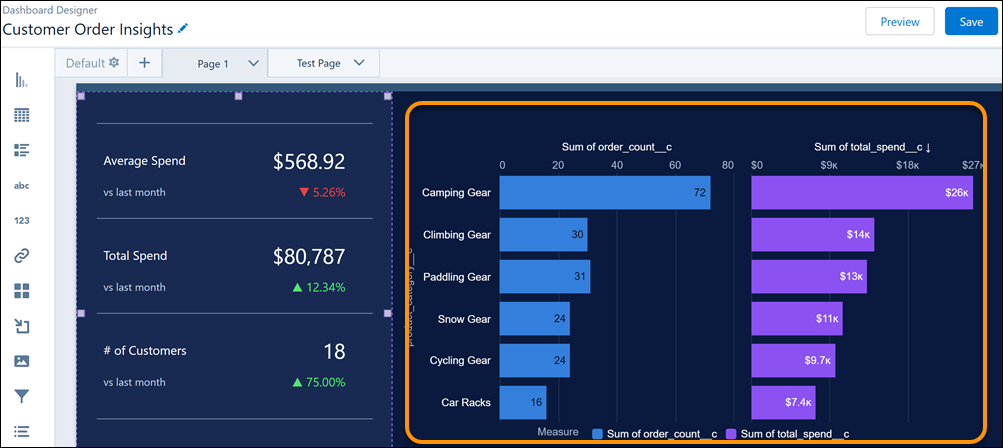
Let's say you created a CRM Analytics Direct Data for Data 360 dashboard on the Accounts page that shows customer order insights. To add a chart that shows customer orders by product category:
- In the dashboard designer, click Create Query. Alternatively, add a chart widget to the dashboard and click it.
- To build the query on a Data 360 data source, click Salesforce Data
Cloud.
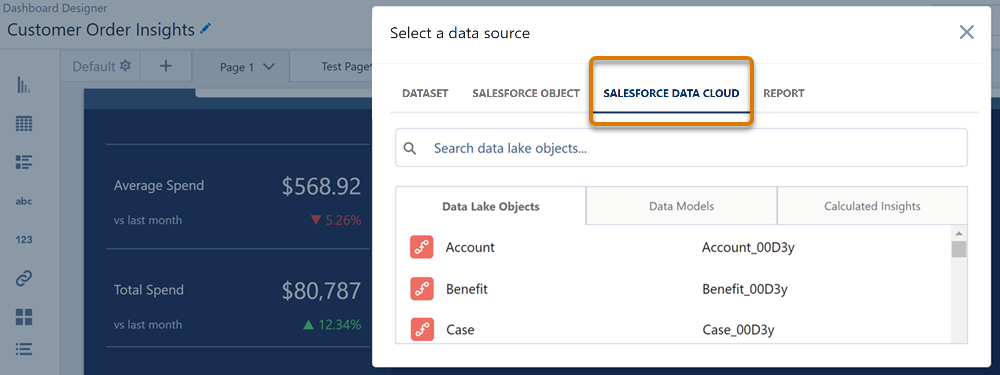
- Select a Data 360 data source that contains order data. Data 360 data is categorized
into one of these source types.
- Data Lake Objects gives users access to data ingested by data streams. They're helpful when you want to analyze and monitor raw data in Data Cloud.
- Data Models give users access to data that is already mapped onto standard information models, such as products, orders, and user engagement.
- Calculated Insights are multidimensional metrics that are calculated in Data 360 and can be pulled into CRM Analytics for further analysis.
 Note Data 360 objects shared to Remote Data 360 orgs are fully supported in CRM Analytics through Direct Query to Data 360.
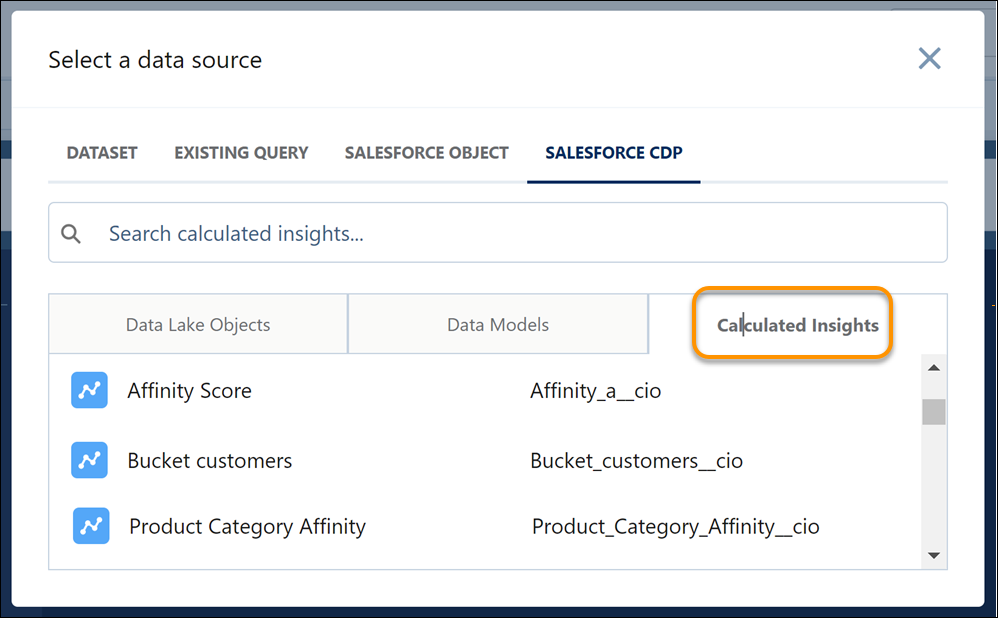
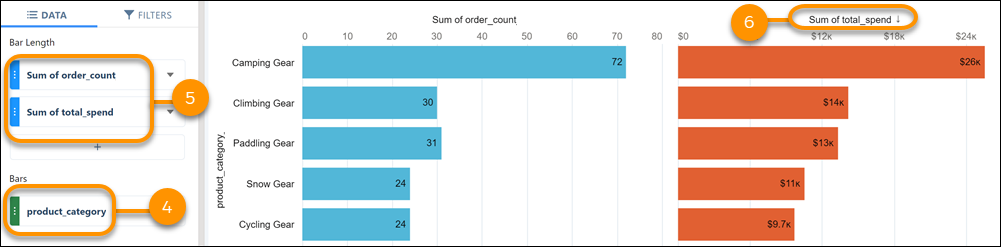
- In the lens that opens, group the orders by product category.
- Add total spend and number of orders as measures in the chart.
- Sort the chart by total spend.
- To save your changes to the dashboard, click Done.
For advanced or custom queries, switch to Query mode and write your own custom SQL queries against Data 360 records.
Did this article solve your issue?
Let us know so we can improve!