
You are here:
Launch Explorations for Data 360 with a Single Click
Analyze and surface customer engagement patterns from Data 360 records without switching to Analytics Studio and creating dashboard queries. With CRM Analytics Direct Data for Data 360, you can now explore calculated insights, data lake objects, and data models from the data object’s record page. Review, profile, and trend data in tables and charts, or run queries on Data 360 right in their business workflow.
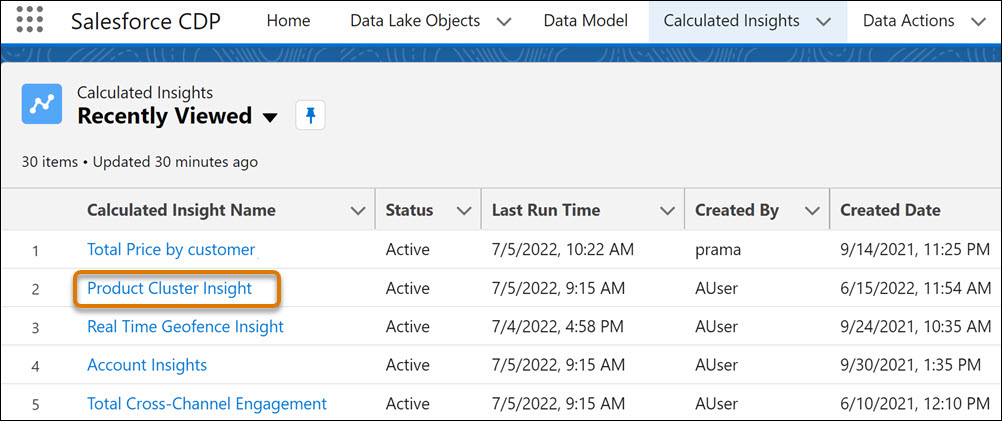
Let’s say you created a calculated insight on product clusters in a Data 360 dashboard. To review spending by product categories in a funnel chart in CRM Analytics:
-
In the Calculated Insights tab, click the insight built on product clusters.
-
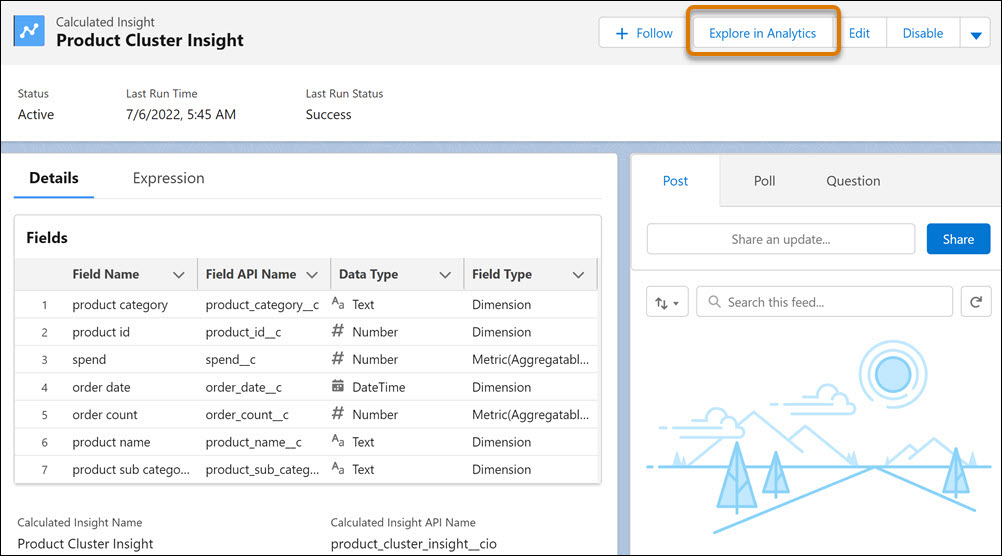
From the insight’s record page, click Explore in
Analytics.
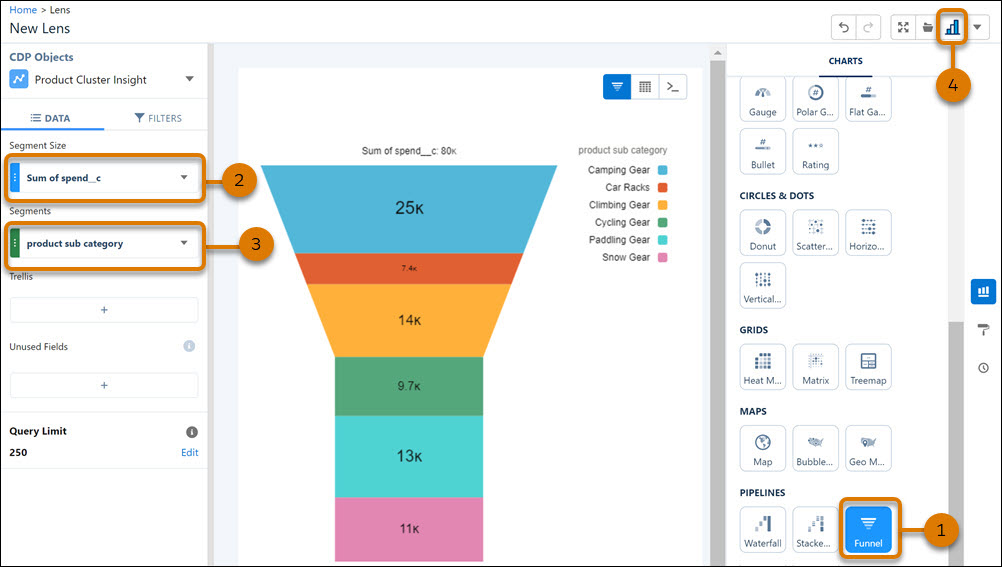
- From the chart gallery, select Funnel (1).
- Aggregate the data by amount spent (2).
- Group data by product subcategory (3).
-
To clip your lens to a dashboard, switch to Analytics Studio (4).
Did this article solve your issue?
Let us know so we can improve!