
You are here:
Compare Subgroups with the Global Average
Explore how a subgroup (category or bucket) relates to a variable’s global average. Isolating a subgroup helps you better understand how it relates to the model’s goal.
To compare a subgroup with the global average:
- Open a Model.
- In the Variables panel, select a variable you want to investigate.
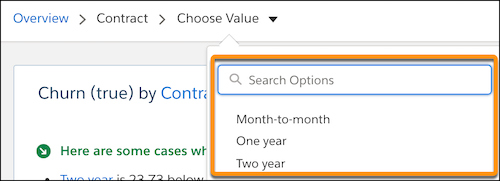
-
In the Filter Selector, choose the value you want to compare with the global
average.
Einstein shows a summary of the comparison between the selected value and the global average.
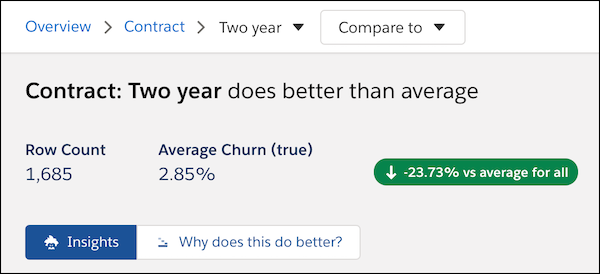
The insights list shows related insights you can explore.
- To dig deeper, click Why does this do better? or Why does this do worse? as appropriate. To learn more, see Explore Why a Value Does Better or Worse Than Average.
Did this article solve your issue?
Let us know so we can improve!