
You are here:
Explore Insights for Multiclass Outcomes
Learn what Einstein Discovery insights can tell you about your multiclass classification solution.
Multiclass classification models predict probable outcomes for 3–10 categories. For example, a manufacturer can predict, based on customer attributes, which of three service contracts a customer is most likely to choose.
-
Open a Model that is associated
with a multiclass classification use case. You see the insights summary.
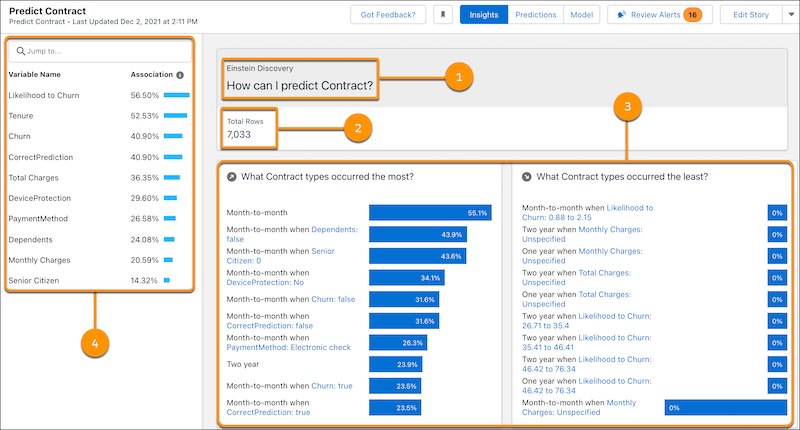
# Area Description 1 Title How can I predict {outcome}? 2 Total Rows Number of rows in the training dataset associated with this prediction. 3 Variables Panel List of top predictor variables associated with this prediction. 4 Summary Side-by-side summaries showing the relative frequency (a percentage) of each class by subgroups. The left-side summary shows which class subgroups occurred the most. The right-side summary shows which subgroups occurred the least. -
To see individual insights, either scroll down to Top Insights or, in the Variables
panel, click a variable to filter the insights.
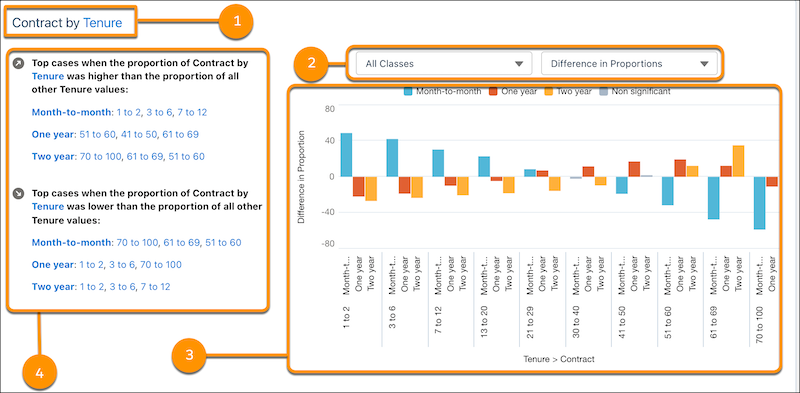
# Area Description 1 Title Title of this insight. 2 Selectors Enable you to:
- Selectively view or hide classes in the chart.
- Switch the chart to show either proportions or the difference in proportions (default). Try switching to determine which visualization makes it easiest to interpret the data.
3 Chart Interactive chart that shows the proportional frequency of individual classes in the outcome.
- X-axis: Either proportion or the difference in proportion
- Y-axis: Subgroup for this insight
4 Explanations Interactive text explanations for the chart. -
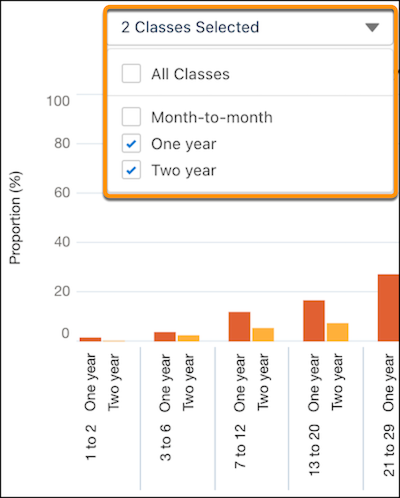
To filter the classes in the insight, clear the check box next to any class you want to
hide.
-
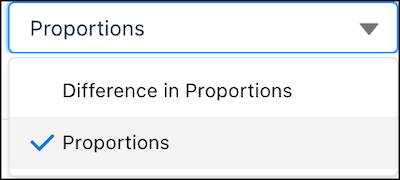
To switch between proportions and the difference in proportions, select it from the
list.
-
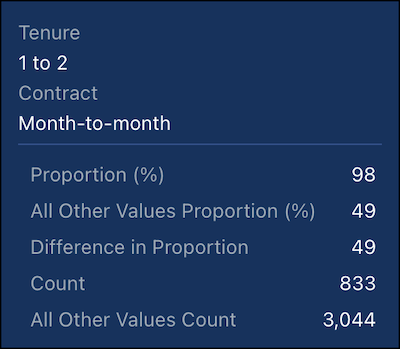
To see details in the chart, hover over a
bar.
Did this article solve your issue?
Let us know so we can improve!