
You are here:
Explore a First-Order Insight for a Date Variable
When you select a date variable, Einstein displays a chart with the date variable along the horizontal axis.
The following example shows a descriptive insight with a date explanatory variable.
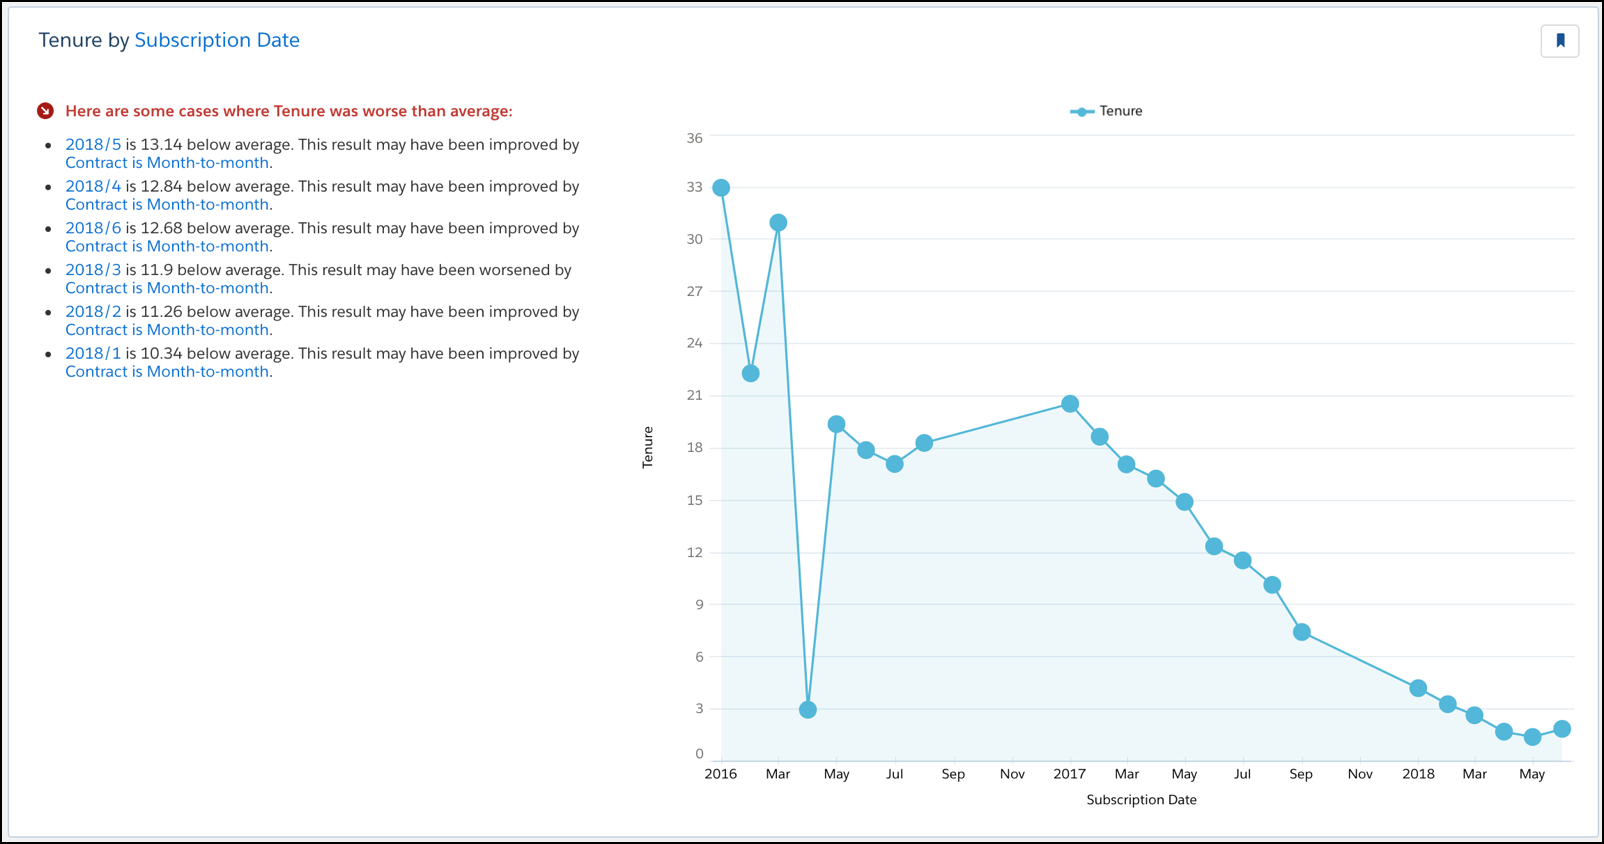
To help orient you to what this chart reveals, refer to the headline on the left. In the chart, generally look for blue bars, starting from left to right.
| Axis | Description |
|---|---|
| Horizontal | Explanatory Variable (date) for this insight. Sorted chronologically from left to right. |
| Vertical | Outcome Variable for this model. |
To see statistical details, hover over a bar in the chart. The word Condition refers to what’s described in the insight heading.
| Field | Description |
|---|---|
| Total | Sum of Outcome Variable for all observations that meet the Condition. |
| Count | Number of observations that meet the Condition. |
| Different from Average | The average for Condition minus the global average. |
| Outcome Variable | Average of Outcome Variable for all observations that meet the Condition (Sum / Count). |
| Global Average | Global average of all variables. |
Did this article solve your issue?
Let us know so we can improve!