
You are here:
Explore a First-Order Insight for a Numeric Variable
When you select a numeric explanatory variable, Einstein displays a bar chart with the numeric variable along the horizontal axis.
The following example shows a descriptive insight with a numeric explanatory variable.
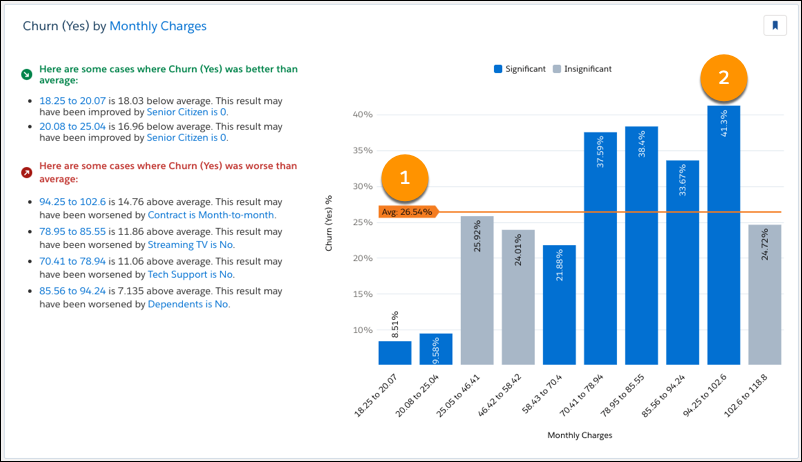
To help orient you to what this chart reveals, refer to the headline on the left. In the chart, generally look for blue bars, starting from left to right.
Chart Axes
| Axis | Description |
|---|---|
| Horizontal | Explanatory variable (number) for this insight. Each bar represents a value (or bucket) of the explanatory variable. Values are sorted numerically from left to right. A numeric variable with low cardinality (10 or fewer observations) is converted to a text variable. Einstein Discovery displays this value along the x-axis rather than in a range (bucket). |
| Vertical | Outcome variable for this model. |
Chart Elements
| Number | Element | Description |
|---|---|---|
| 1 | Global Average | The orange line represents the global average of all variables. |
| 2 | Bucket of the Explanatory Variable | Each vertical bar represents a value or bucket (range) of the explanatory variable.
Hover-over details:
|