
You are here:
Explore Why a Value Does Better or Worse Than Average
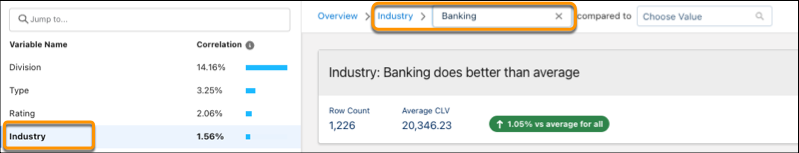
Learn why a category or bucket does better or worse than the global average.
While descriptive insights show what happened in your data, diagnostic insights show why it happened. Diagnostic insights drill deeper and help you understand which variables most significantly drive the business outcome you’re analyzing. Einstein Discovery derives diagnostic insights from the model it produces. Einstein uses waterfall charts to visualize diagnostic insights.
- Open a Model.
- In the Variables panel, click a variable.
- From the Filter Selector, choose a value.
-
Insights based on your selections are listed in the first card.
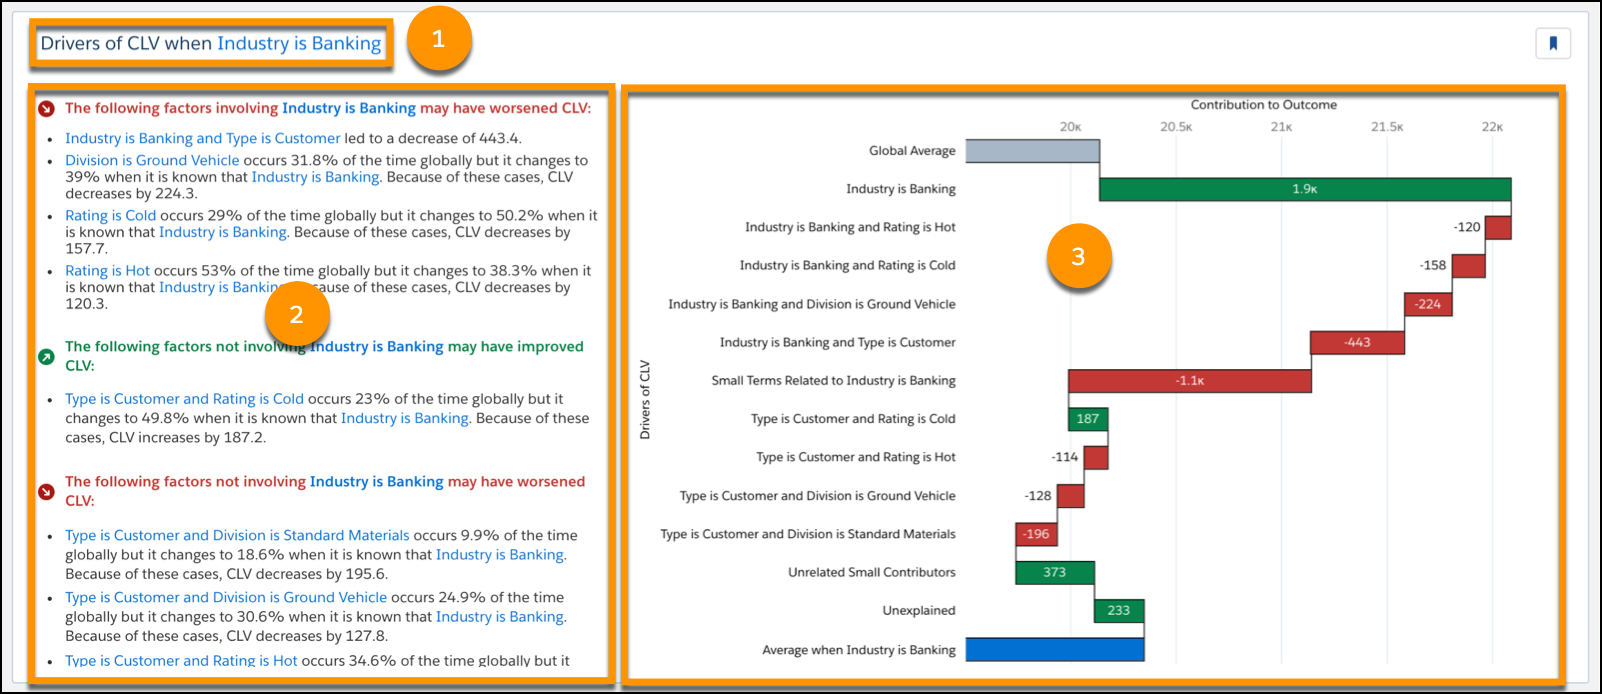
# Area Description 1 Title Drivers of {outcome} when {selected value}. 2 Factor Explanations Describe how each factor contributed to the predicted outcome. 3 Waterfall Chart Visualization of the factors, how they contributed to the predicted outcome, and in comparison to the global outcome.
- X-axis represents the drivers' contribution to the model’s outcome.
- Y-axis represents the drivers (explanatory variables) of the outcome variable.
The waterfall chart contains the following elements.
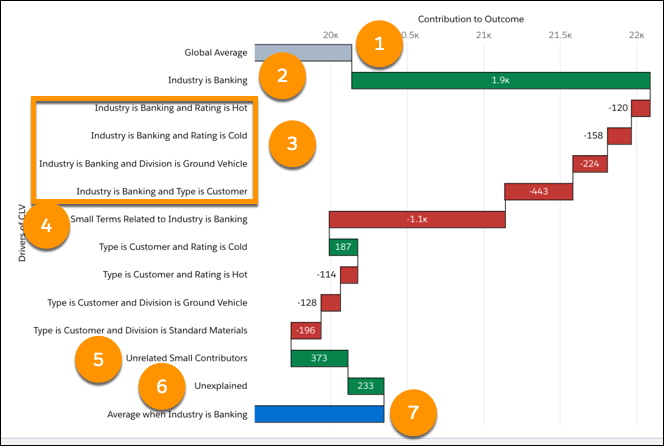
 Note In the following table, Impact and Contribution to Outcome mean the same thing. The value represents an estimate of the contribution of a single term to the predictions in aggregate, across all predictions. It compares the subset to the global dataset.
Methodology: To compute impact, Einstein Discovery uses an aggregation of SHAP (SHapley Additive exPlanations) values. To learn more, see the original paper, A Unified Approach to Interpreting Model Predictions, by Scott Lundberg and Su-In Lee.
Number Driver / Term Description 1 Global Average The gray bar represents the global average of all variables. Hover-over details:
- Drivers of Outcome: Global Average
- Global Mean: Mean Outcome for all variables in the dataset.
- Global Count: Number of observations for all variables in the dataset.
- Contribution to Outcome: Same as the Global Mean.
2 Driver (First Impact) Category for this insight. Represents the focus of this investigation. Hover-over details:
- Drivers of Outcome when Category occurs.
- Impact: Contribution to all predictions. The amount of change on Outcome that the model attributes to this Category.
- Coefficient: GLM (generalized linear model) only. Represents the contribution of this term for a single prediction. For numeric outcomes, the coefficient quantifies the change in the mean of the outcome variable when there is a one-unit shift in the explanatory variable, assuming all other variables in the model remain constant. For binary classification outcomes, the coefficient represents log odds (the logarithm of the odds).
- Frequency: How much of the entire dataset this Condition represents.
- Conditional Frequency: How much of this subset the Category represents.
- Precluded Sum: Aggregate contribution to the outcome of all observations that are included in the Global Average (gray bar) but are excluded from the Category Average (blue bar). For example, if the Global Average includes all months in a year, and the Category Average includes only December, then the Precluded Sum includes January through November.
- Precluded Count: Number of terms that were precluded from this insight (terms that are not this Category).
- Contribution to Outcome: Same as Impact.
3 Driver (Next 4 Impacts) Terms interacting with Category. Hover-over details:
- Drivers of Outcome when Condition occurs.
- Impact: The amount of change on Outcome that the model attributes to this Condition.
- Coefficient: GLM (generalized linear model) only. Represents the contribution of this term for a single prediction. For numeric outcomes, the coefficient quantifies the change in the mean of the outcome variable when there is a one-unit shift in the explanatory variable, assuming all other variables in the model remain constant. For binary classification outcomes, the coefficient represents log odds (the logarithm of the odds).
- Frequency: How much of the entire dataset this Condition represents.
- Conditional Frequency: How much of this subset the Condition represents.
- Contribution to Outcome: Same as Impact.
4 Small Terms Related To The aggregated effect of all terms interacting with Category that do not appear in the other bars shown previously. There are many factors impacting the outcome for the selected variable. The chart can't possibly contain all of them. It shows only the most impactful ones. The remaining impacts are grouped together in small terms. This is done specifically to differentiate them from the groups below (Unrelated Small Factors and Unexplained).
Hover-over details:
- Combined Impact: Net impact on the Outcome of all the combined terms.
- Terms Combined: Number of terms combined.
- Contribution to Outcome: Same as Combined Impact.
Other Impacts Terms that are not specific to Category but that still occur more or less often. Hover-over details:
- Drivers of Outcome when Condition occurs.
- Impact: The amount of change on Outcome that the model attributes to this Condition.
- Coefficient: GLM (generalized linear model) only. Represents the contribution of this term for a single prediction. For numeric outcomes, the coefficient quantifies the change in the mean of the outcome variable when there is a one-unit shift in the explanatory variable, assuming all other variables in the model remain constant. For binary classification outcomes, the coefficient represents log odds (the logarithm of the odds).
- Frequency: How much of the entire dataset this Condition represents.
- Frequency: How much of the entire dataset this Condition represents.
- Conditional Frequency: How much of this subset the Condition represents.
- Contribution to Outcome: Same as Impact.
5 Unrelated Small Contributors Unrelated small contributors are not specific to Category. This section shows us factors that have positive or negative effects on all Outcomes.
Hover-over details:
- Combined Impact: Net impact on the Outcome of all the unrelated small contributors.
- Terms Combined: Number of terms combined into the unrelated small contributors.
- Contribution to Outcome: Same as Combined Impact.
6 Unexplained Represents the unexplained variables on the Outcome. In diagnostic insights, drivers are derived from a model, and no model is perfect. The unexplained bar quantifies the gap that this model hasn't been able to attribute to different drivers. 7 Category Average The blue bar represents the average for the selected category. Hover-over details:
- Drivers of Outcome: Average when Category
- Global Mean: Mean Outcome for Category.
- Global Count: Number of observations for Category.
- Contribution to Outcome: Same as Global Mean.