
You are here:
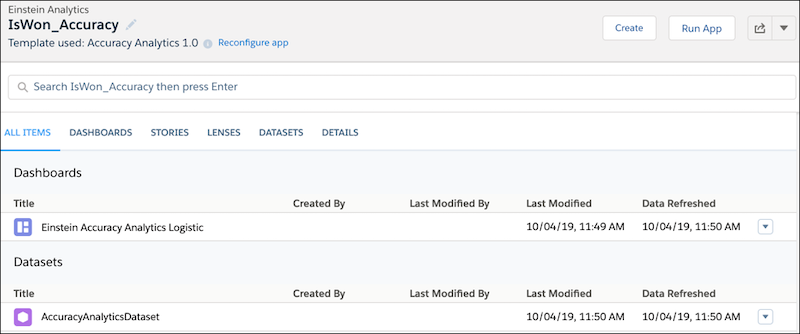
View the Accuracy Analytics App for a Prediction Definition
After creating Accuracy Analytics, view its dashboard to see prediction accuracy metrics and a chart.
Note Einstein Discovery stories are now models. We wish we could snap our fingers to update
the name everywhere, but you can expect to see the previous name in a few places until we
replace it.
Update Data in the Dataset (Optional)
When you create Accuracy Analytics, its dataflow populates the dataset with a snapshot of the predictions for the Salesforce object. To get the latest data for your dashboard, refresh the data in the dashboard’s dataset by running the associated dataflow. You can run the dataflow in several ways:
- In the Data Manager, run the dataflow manually. For instructions, see Run a Dataflow Manually.
- In the Data Manager, schedule the dataflow to run periodically. For instructions, see Schedule a Dataflow to Run Automatically.
- In the Model Manager, reconfigure the app and save changes, which triggers the dataflow to run.
View Prediction Accuracy
To open an Analyze Accuracy App for a prediction definition:
-
View a Prediction Definition in Model
Manager.
If your prediction definition meets the prerequisites, you see the Analyze Accuracy button in the upper right corner of your screen. Click this button to open an existing app.
-
Click Analyze Accuracy.
If found, the app opens.
-
Click Run App.
Einstein runs the App and displays its dashboard.
Dashboard for Logistic Regression
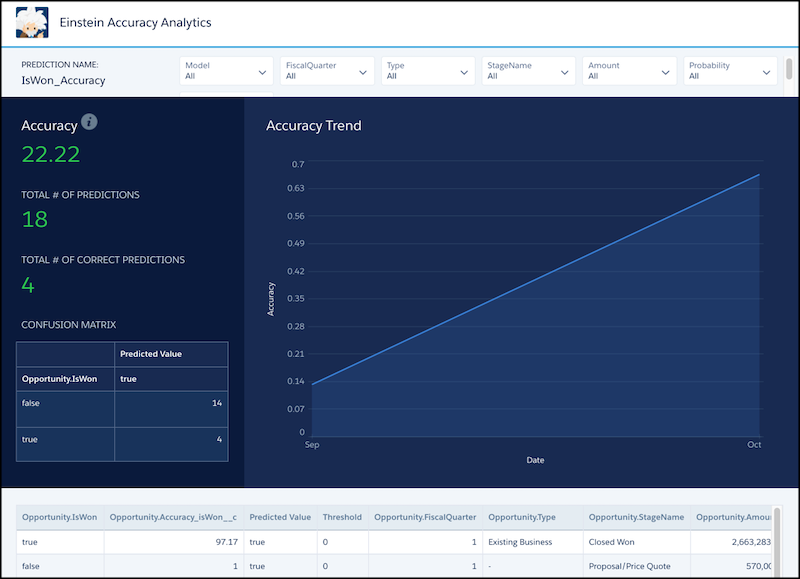
Area Description Accuracy Accuracy of this prediction definition. Number of correct predictions divided by the total number of predictions. Excludes nulls in the predicted or actual field. Total # of Predictions Number of all predictions made. Total # of Correct Predictions Number of predictions that were correct. Confusion Matrix Used to evaluate the trade-offs between different error types based on the threshold value. It displays how many times the model correctly and incorrectly classifies a record as true and false at the associated threshold. Details Table Each row represents a scored record (such as an Opportunity) with the predicted value, actual value, and other details. Accuracy Trend Chart Shows prediction accuracy (x-axis) over time (y-axis). Dashboard for Linear Regression
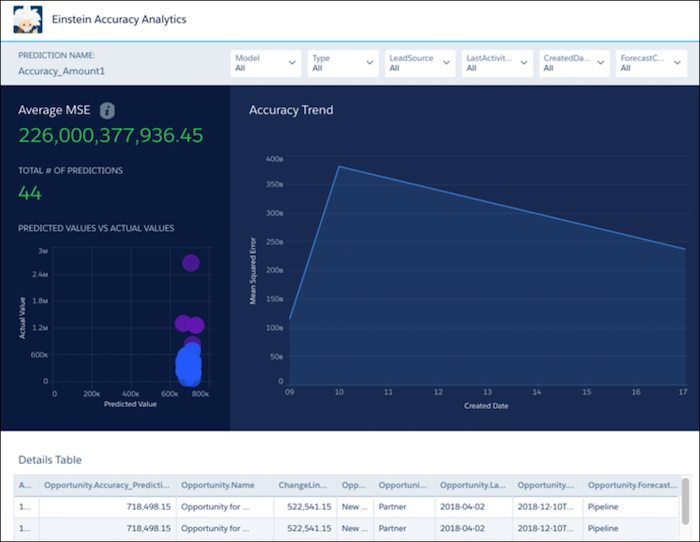
Area Description Average MSE Measures the average squared error of the prediction definition’s predictions. Computes the square difference between the observed (actual) outcome and the predicted values, and then averages them. Total # of Predictions Number of all predictions made. Predicted Values vs Actual Values Residuals plot chart that reveals the robustness of your model. A residual represents the difference between the actual value and the model’s predicted value. Details Table Each row represents a scored record (such as an Opportunity) with the predicted value, actual value, and other details. Accuracy Trend Chart Shows prediction average MSE (x-axis) over time (y-axis). - If you want, drill down into the data by filtering columns.
Did this article solve your issue?
Let us know so we can improve!