
You are here:
Cross Validation Tab for Numeric Use Cases
To test a model’s ability to make predictions, Einstein Discovery uses k-fold cross-validation, a process that reduces sampling bias when validating a model. This tab summarizes the results of the cross-validation process for this model, as well as some of the underlying computational details.
Navigate to the Cross Validation Tab
In Performance, click Model Evaluation, then Cross Validation.
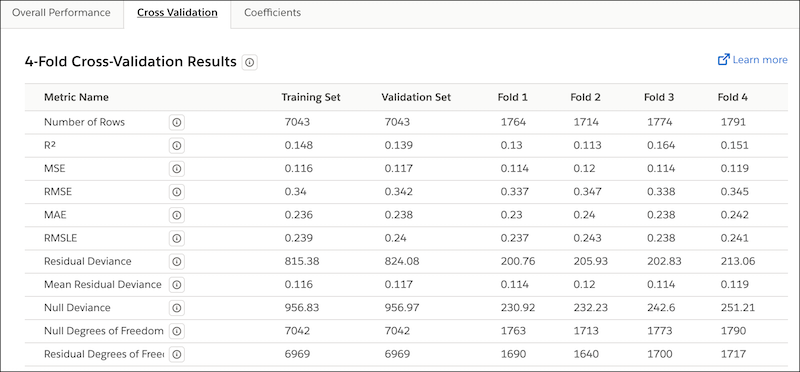
Columns on the Cross Validation Tab
| Column Name | Description |
|---|---|
| Metric Name | Name of the metric. |
| Training Set | Metrics for the set of observations in the CRM Analytics dataset that Einstein Discovery used to train the model. |
| Validation Set | Metrics for the set of observations in the CRM Analytics dataset that Einstein Discovery used to validate the predictions generated by the trained model. |
| Fold #1 | Metrics for the first fold. |
| Fold #2 | Metrics for the second fold. |
| Fold #3 | Metrics for the third fold. |
| Fold #4 | Metrics for the fourth fold. |
Metrics on the Cross Validation Tab
The Cross Validation tab shows the following metrics for a model.
| Metric Name | Description |
|---|---|
| Number of rows | Total number of observations. The meaning of a value varies per column.
|
R2 |
R2 measures the model's ability to explain variation in the outcome, which is an indicator of how predictive the model is. Range:
|
| MSE | Mean Squared Error. Measures the average squared error of the model’s predictions. MSE computes the square difference between the observed (actual) outcome and the predicted values, and then averages them. |
| RMSE | Root Mean Squared Error. Represents the square root of MSE. RMSE measures the difference between the values predicted by the model and the observed (actual) values. You can think of this value as the “standard deviation of errors.” |
| MAE | Mean Absolute Error. Measures the absolute difference between the actual value and the prediction. All differences are weighted equally in this average, which means that it is not as sensitive to outliers as MSE. |
| RMSLE | Root-Mean-Squared Logarithmic Error. Compare with RMSE:
|
| Residual Deviance | Measures how well the developed model performs on your dataset.
|
| Mean Residual Deviance | Measures how well the model performs on your dataset. Lower values indicate a better fit. |
| Null Deviance | Measures how well a simple model performs on your dataset. Lower values mean a better fit. Thus, if Null Deviance is low, your data is not particularly complex. |
| Null Degrees of Freedom | Represents the Chi-Square distributions of Null Deviance. |
| Residual Degrees of Freedom | Represents the Chi-Square distributions of Residual Deviance. |
Model Validation Methodology
Einstein Discovery conducts k-fold cross-validation (k=4) on your model. This process involves the following steps:
- Randomly divide all the observations in the CRM Analytics dataset into four separate partitions of equal size.
- Conduct four test passes (folds) in which three of the partitions serve
as the training set and one partition serves as the test
set.
 Note After completing the four test passes, each partition has served one time as the validation set and three times as part of the training set.
 - For each fold, compile model metrics.
- Take the average of the four folds for an overall score.