
You are here:
Overall Performance Tab for Binary Classification Use Cases
The Overall Performance tab shows key summary metrics for model quality.
Navigate to the Overall Performance Tab
In Performance, click Model Evaluation, then Overall Performance.
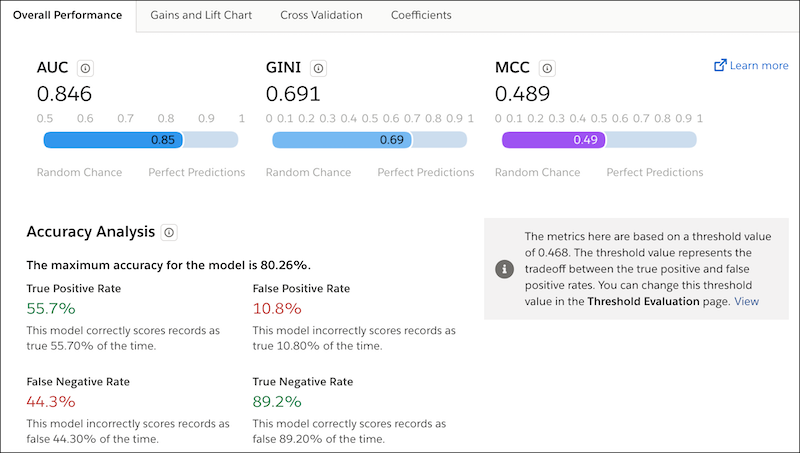
Summary Metrics
| Metric | Description |
|---|---|
| AUC | Area Under the Curve. Measures the logistic model’s rate of correct classification. AUC is frequently used to evaluate model quality in classification use cases. Range:
|
| GINI | GINI Index. Measures how closely this classification model performs to a theoretically best possible model. Range:
|
| MCC | Matthews Correlation Coefficient. Measures the quality of a classification model. Provides a more even representation of the four parts of the confusion matrix than other classification metrics. In contrast, accuracy and the F1 score can be misleading when one class is predicted much more accurately than another in a classification use case. Range:
|
Accuracy Analysis
Accuracy measures the proportion of outcomes that the model predicted correctly.
Formula:
Accuracy = (TP + TN) / Total # of Predictions
where
- TP represents the number of true positives (positive prediction with a positive result)
- TN represents the number of true negatives (negative prediction with a negative result)
- Total # of Predictions that the model made (both correct and incorrect)
| Metric | Description |
|---|---|
| The maximum accuracy for this model is | The maximum accuracy for this model. |
| True Positive Rate | This model correctly scores records as true n% of the time. |
| True Negative Rate | This model correctly scores records as false n% of the time. |
| False Positive Rate | This model incorrectly scores records as true n% of the time. |
| False Negative Rate | This model incorrectly scores records as false n% of the time. |
| Threshold Value | The threshold value represents the tradeoff between the true positive and false positive rates. You can adjust this threshold setting in the Threshold Evaluation for Binary Classification Use Cases. |