
You are here:
Overall Performance Tab for Numeric Use Cases
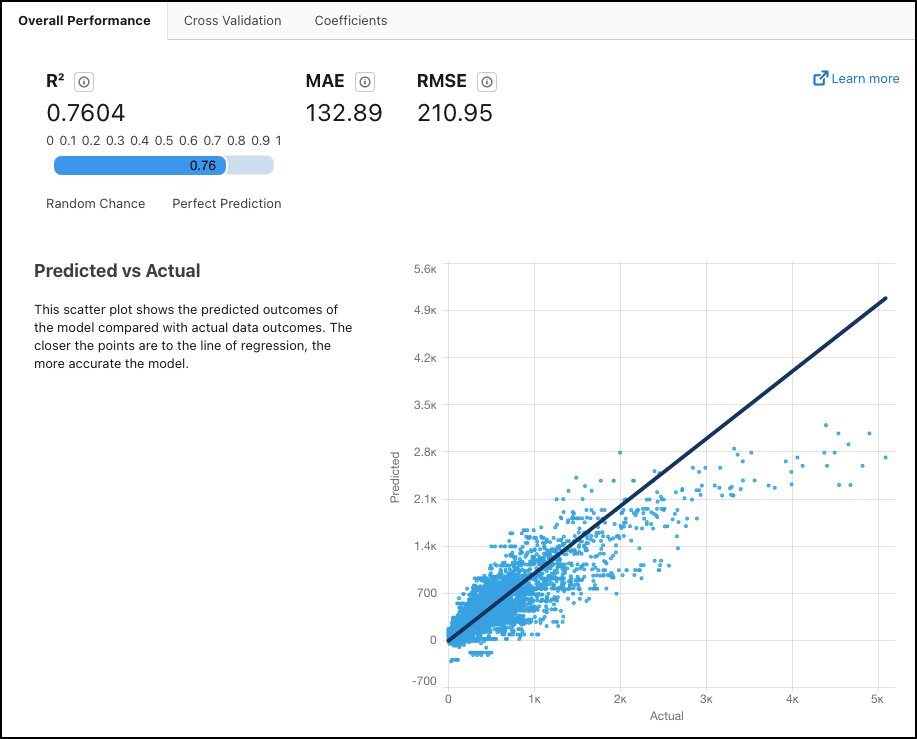
The Overall Performance tab shows metrics for key indicators and model quality.
Navigate to the Overall Performance Tab
In Performance, click Model Evaluation, then Overall Performance.
Summary Metrics
| Metric | Description |
|---|---|
R2 |
R2 measures the model's ability to explain variation in the outcome, which is an indicator of how predictive the model is. Range:
|
| MAE | Mean Absolute Error. Measures the absolute difference between the actual value and the prediction. All differences are weighted equally in this average, which means that it is not as sensitive to outliers as MSE. |
| RMSE | Root Mean Squared Error. Represents the square root of MSE (Mean Squared Error, which is the average squared error of the model’s predictions). RMSE measures the difference between the values predicted by the model and the observed values. You can think of RMSE as the "standard deviation of errors". |
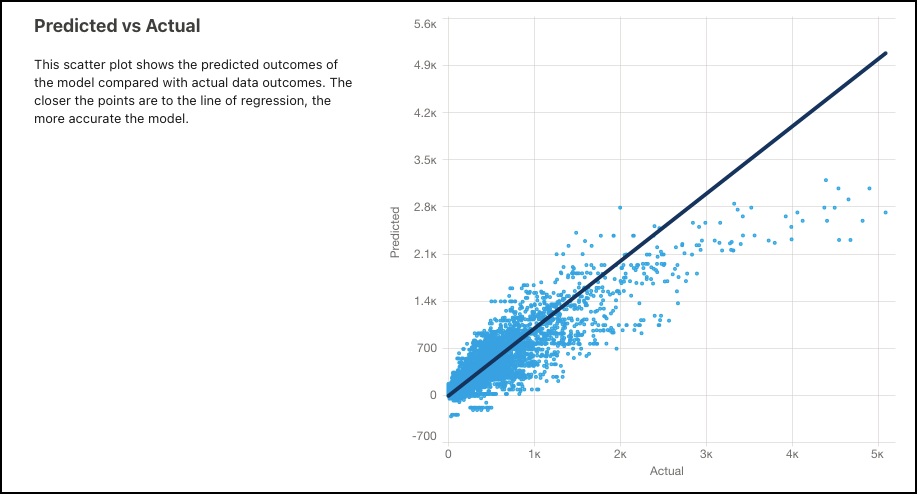
Predicted vs Actual
Use this scatter plot to visually compare the model's predicted outcomes with actual outcomes. The closer the points are to the line of regression, the more accurate the model.
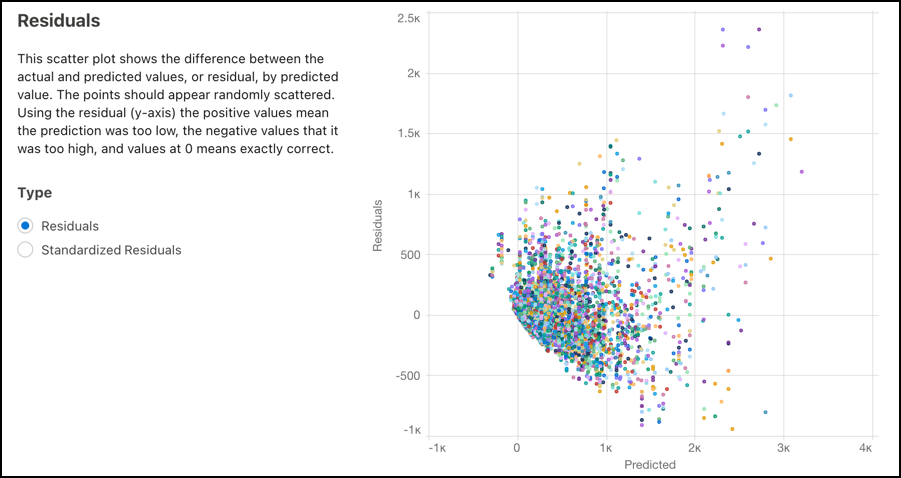
Residuals
Use this scatter plot to see the difference between the actual and predicted values (residuals), by predicted value. The points must appear randomly scattered. Points at 0 on the y-axis represent predictions that were exactly correct, while points above 0 were too low, and points below 0 were too high.
Choose the type of residuals you want to see. Residuals shows the difference between the actual and predicted values, or the raw residual values. Standardized Residuals shows raw residual values divided by the standard deviation.
Normal QQ Plot for Standardized Residuals
For regression models, one of the key assumptions is that the residual errors for the outcome variable are normally distributed. Use the QQ (quantile-quantile) plot to quickly check this assumption and determine whether and how residual errors depart from normality.
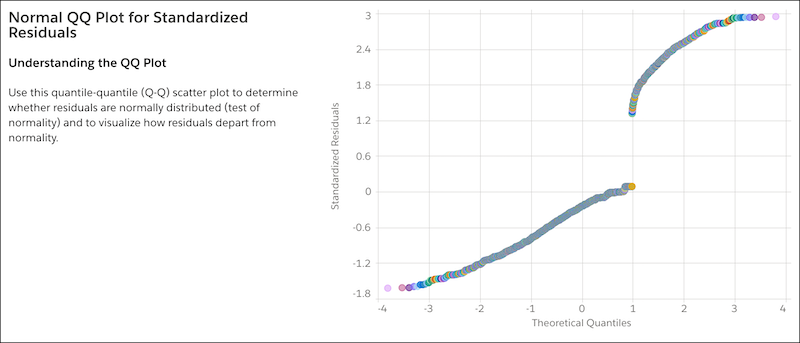
If the QQ plot shows your residual errors to be approximately linear, then you can be confident that your model satisfies the normal distribution assumption.