
You are here:
Overall Performance Tab for Multiclass Classification Use Cases
The Overall Performance tab shows key metrics for model quality.
Navigate to the Overall Performance Tab
In Performance, click Model Evaluation, then click Overall Performance.
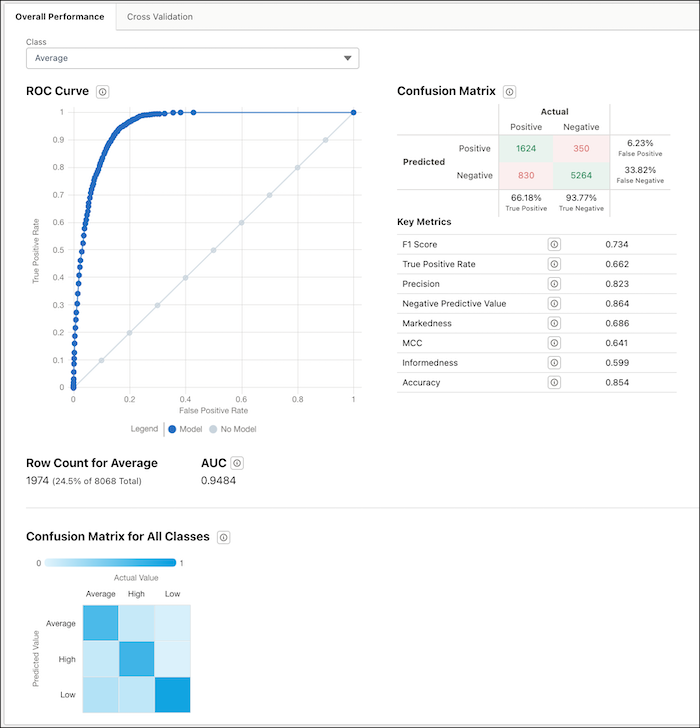
Class Selector
Select a class to see its performance statistics.
ROC Curve
Receiver Operating Characteristic Curve. Displays the performance measurement for the selected class. ROC is a probability curve and AUC (Area Under the Curve) represents the degree or measure of separability. This chart shows how well the model is able to distinguish between classes.
- Y-axis: True Positive Rate: TPR = TP / (TP + FN)
- X-axis: False Positive Rate>: FPR = FP / (FP + TN)
- Model (blue line)
- No Model (gray line)—the same as random chance
Row Count for the Selected Class
Number of observations in the training dataset associated with the selected class.
AUC
Area Under the Curve. Measures the model’s rate of correct classification for the selected class.
Range:
- 0.5 means that the model performed no better than random guessing.
- 1.0 means that the model correctly classified the data 100% of the time. An AUC of 1.0 is suspect because it can indicate data leakage: the data used to train your model includes one or more columns that contain the information that you are trying to predict.
Confusion Matrix for the Selected Class
The confusion matrix is used to evaluate the trade-offs between different error types for the selected class. It displays how many times the model correctly and incorrectly classifies an observation as true and false for the class. Key Metrics:
| Metric | Description |
|---|---|
| F1 Score | The F1 score represents the harmonic average of precision and recall. Formula: F1 = 2 * ( (precision * recall) / (precision + recall) ) where
|
| True Positive Rate | The True Positive Rate (TPR) measures the proportion of true positives that the model predicted correctly. Formula: TPR = TP / (TP + FN) where
Range:
The True Positive Rate is also known as Sensitivity or Recall. |
| Precision | Precision describes the proportion of positive results that are true positive results. Formula: Precision = TP / (TP + FP) where
Range: Precision is also known as Positive Predictive Value (PPV).
|
| Negative Predictive Value | Negative Predictive Value (NPV) describes the proportion of negative results that are true negative results. Formula: NPV = TN / (TN + FN) where
Range:
|
| Markedness | Markedness measures the trustworthiness of positive and negative predictions by the model. Formula: Markedness = PPV + NPV - 1 where
|
| MCC | The Matthews Correlation Coefficient (MCC) is a model quality measure. MCC provides a more even representation of the four parts of the confusion matrix than other classification metrics. Range:
|
| Informedness | Informedness measures how informed the model is about positives and negatives. Formula: Informedness = TPR + TNR - 1 where
|
| Accuracy | Accuracy measures the proportion of outcomes that the model predicted correctly. Formula: Accuracy = (TP + TN) / Total # of Predictions where
|
Confusion Matrix for All Classes
This chart shows you at a glance how accurately the model predicts each class. Where the row and column for each class intersect in the table, the color of the square indicates the model’s accuracy. The legend shows a color progression from 0 to 1, with 1 representing 100% accuracy. In this example, the darker blue diagonal indicates a high percentage of true positives.