
You are here:
Overview Tab for Binary Classification Use Cases
The Overview tab shows an at-a-glance summary of your model’s quality.
Note Einstein Discovery stories are now models. We wish we could snap our fingers to update
the name everywhere, but you can expect to see the previous name in a few places until we
replace it.
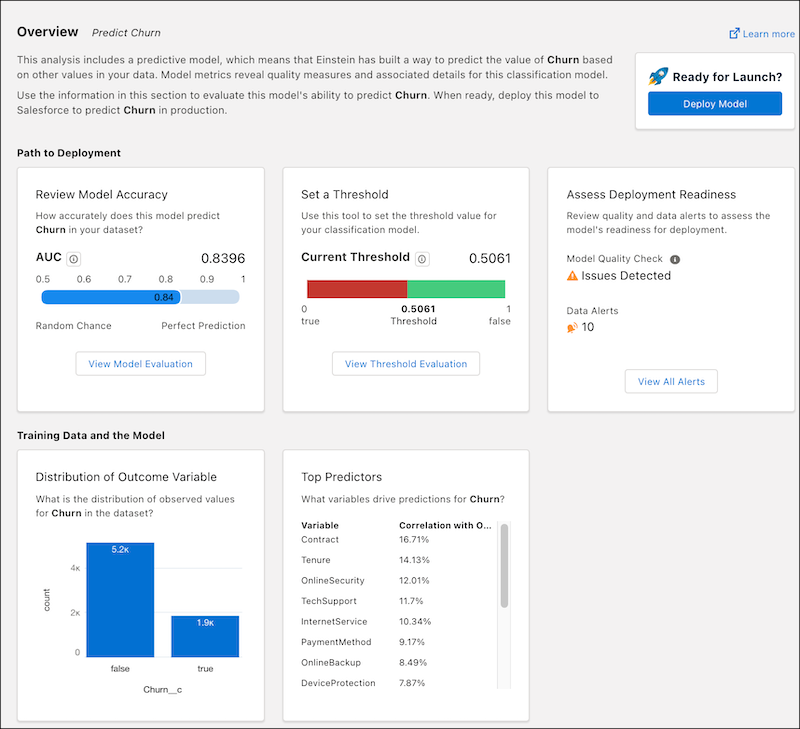
Path to Deployment
| Area | Description |
|---|---|
| Review Model Accuracy | AUC (Area Under the Curve) represents the rate of correct classification by a logistic model. An AUC of 0.5 means that the model performs no better than random guessing. An AUC of 1.0 means that the model correctly classifies data 100% of the time, which can indicate data leakage. Click View Model Evaluation to see the Model Evaluation Tab for Binary Classification Use Cases. |
| Set a Threshold | Shows the current threshold of the model. Click View Threshold Evaluation to go to the Threshold Evaluation for Binary Classification Use Cases. |
| Assess Deployment Readiness | Summarizes the results of quality tests on the training data, certain model metrics, and validation.
Click View All Alerts to Handle Quality Alerts. |
Training Data and the Model
| Area | Description |
|---|---|
| Distribution of Outcome Variable | Shows the distribution of values (count and range) for the outcome variable in the training data. |
| Top Predictors | Lists the top predictors (explanatory variables) for this model and their correlation with the outcome variable. |
Did this article solve your issue?
Let us know so we can improve!