
You are here:
Overview Tab for Numeric Use Cases
The Overview tab shows an at-a-glance summary of your model’s quality.
Note Einstein Discovery stories are now models. We wish we could snap our fingers to update
the name everywhere, but you can expect to see the previous name in a few places until we
replace it.
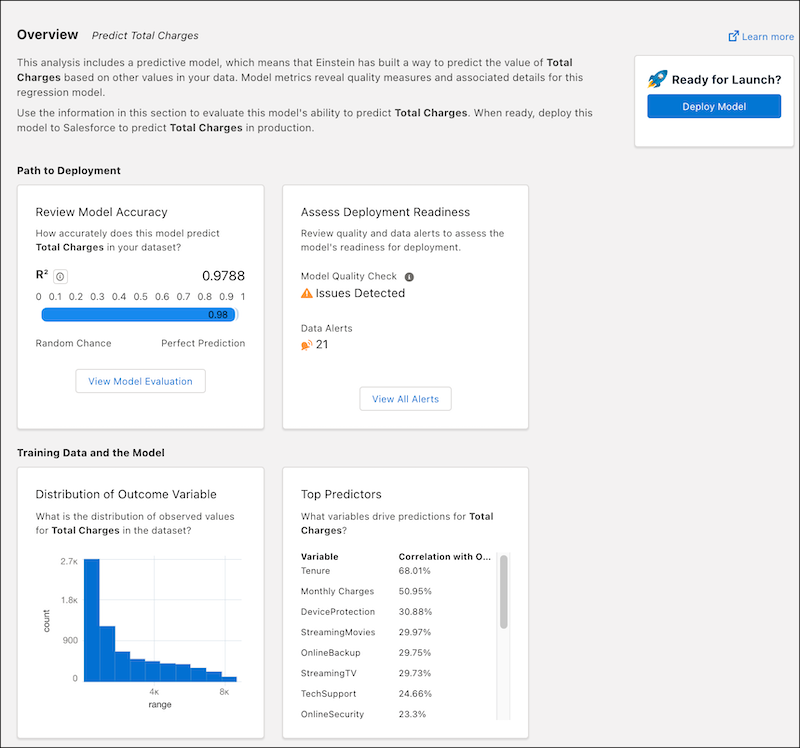
Path to Deployment
| Area | Description |
|---|---|
| Review Model Accuracy | R2 measures a regression's model's ability to explain variation in the outcome. R2 ranges from zero (random chance) to one (perfect model). In general, the higher the R2, the better the model predicts outcomes. Click View Model Evaluation to see the Model Evaluation for Numeric Use Cases. |
| Assess Deployment Readiness | Summarizes the results of quality tests on the training data, certain model metrics, and validation.
Click View All Alerts to Handle Quality Alerts. |
Training Data and the Model
| Area | Description |
|---|---|
| Distribution of Outcome Variable | Shows the distribution of values (count and range) for the outcome variable in the training data. |
| Top Predictors | Lists the top predictors (explanatory variables) for this model and their correlation with the outcome variable. |
See Also
Did this article solve your issue?
Let us know so we can improve!