Loading
Scheduled maintenance for Salesforce HelpRead More
CRM Analytics
Table of Contents
Select Filters

          No results
          No results
          Here are some search tips

          Check the spelling of your keywords.
          Use more general search terms.
          Select fewer filters to broaden your search.

          Search all of Salesforce Help
          Overview Tab for Multiclass Classification Use Cases

          Overview Tab for Multiclass Classification Use Cases

          The Overview tab shows an at-a-glance summary of your model’s quality.

          Note
          Note Einstein Discovery stories are now models. We wish we could snap our fingers to update the name everywhere, but you can expect to see the previous name in a few places until we replace it.

          Navigate to the Overview Tab

          In Performance, click Overview.
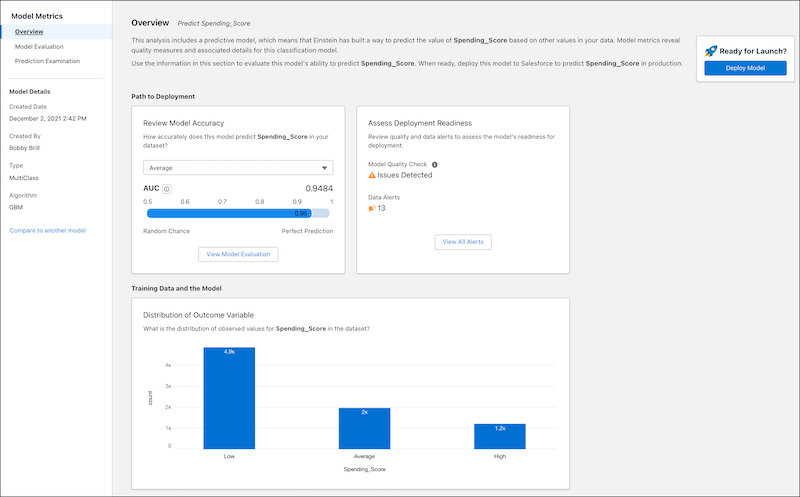
          Overview tab showing, sections on path to deployment and training data

          Path to Deployment

          Area Description
          Review Model Accuracy

          To view a model’s accuracy for a given class, select the class from the list. The AUC (Area Under the Curve) measures the model’s rate of correct classification for the selected class.

          Range:

          • 0.5 means that the model performed no better than random guessing.
          • 1.0 means that the model correctly classified the data 100% of the time. An AUC of 1.0 is suspect because it can indicate data leakage: the data used to train your model includes one or more columns that contain the information that you are trying to predict.

          Click View Model Evaluation to see the Model Evaluation Tab for Multiclass Classification Use Cases.

          Assess Deployment Readiness

          Summarizes the results of quality tests on the training data, certain model metrics, and validation.

          • Model quality check: Indicates whether issues exist.
          • Data Alerts: Indicates the number of unresolved data issues associated with this model.

          Click View All Alerts to Handle Quality Alerts.

          Training Data and the Model

          The Distribution of Outcome Variable chart shows the distribution of outcome values in the training data for each class.

           
          Loading
          Salesforce Help | Article