
You are here:
Prediction Examination Tab for Binary Classification Use Cases
The Prediction Examination tab allows you to interact with the model metrics and see how they stack up against actual outcomes.
Note Einstein Discovery stories are now models. We wish we could snap our fingers to update
the name everywhere, but you can expect to see the previous name in a few places until we
replace it.
Navigate to the Prediction Examination Tab
In Performance, click Prediction Examination.
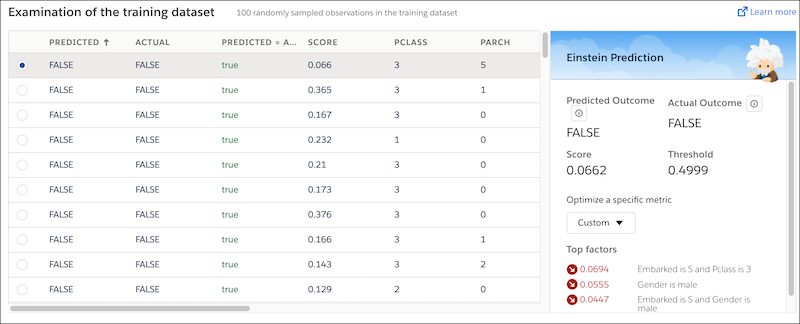
Examination of the Training Dataset
The table displays a random sample of 100 rows of data (observations) in the CRM Analytics dataset used to train the model. Columns in the table represent columns in the dataset.
Einstein Prediction Panel
Select a row in the table to display details about the prediction that the model generated for that observation.
| Metric | Description |
|---|---|
| Predicted Outcome | Outcome that the model predicted. |
| Actual Outcome | Outcome that actually occurred (observed). |
| Score | Prediction score for this observation. |
| Threshold | The threshold value for the model. The threshold represents the tradeoff between the true positive and false positive rates. |
| Optimize a Specific Metric | To maximize the threshold for a common metric, select that metric from the list. |
| Top factors | Shows the features that have the biggest contribution to the outcome. |
Did this article solve your issue?
Let us know so we can improve!