
You are here:
Threshold Evaluation for Binary Classification Use Cases
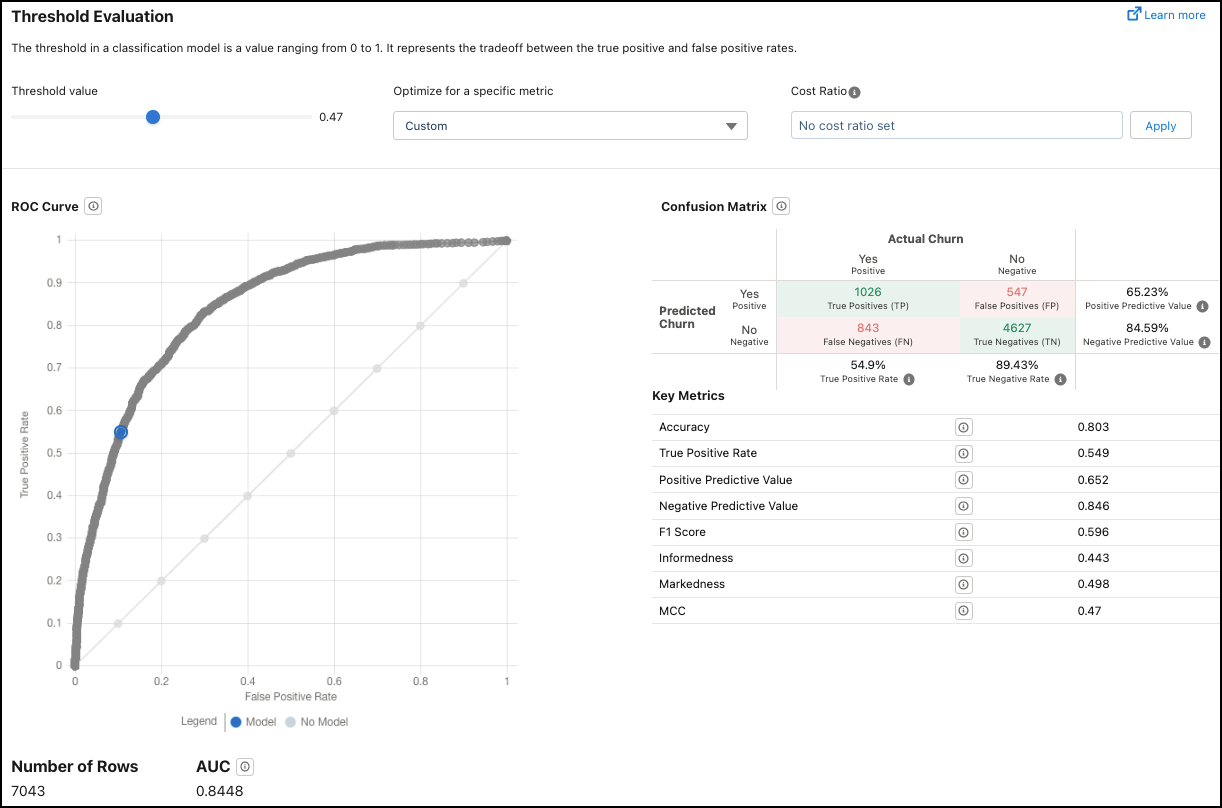
Threshold Evaluation helps you optimize the threshold value for a model. The threshold value tells your model how to classify a binary outcome. If the calculated probability is above the threshold value, Einstein classifies the outcome one way (such as True or Positive). If the calculated probability is below the threshold value, Einstein classifies the outcome the other way (such as False or Negative).
Navigate to Threshold Evaluation
In Performance, click Threshold Evaluation.
Metrics on the Threshold Evaluation Tab
| Metric | Description |
|---|---|
| Controls | You can set an optimal threshold that represents the cutoff for the two outcomes you are predicting. To change the selected threshold value:
The Threshold Value value reflects your selection. In the ROC graph, the blue dot moves to the corresponding location on the Actual Model line that represents the threshold value along the ROC curve. |
| ROC Curve | Receiver Operating Characteristic Curve. Displays the performance measurement at various threshold settings. ROC is a probability curve and AUC (Area Under the Curve) represents the degree or measure of separability. This chart shows how well the model is able to distinguish between classes.
|
| Number of Rows | Number of rows in the training data. |
| AUC | Area Under the Curve. Represents the rate of correct classification by a logistic model. An AUC of 0.5 means that the model performs no better than random guessing. An AUC of 1.0 means that the model correctly classifies data 100% of the time, which can indicate data leakage. |