
You are here:
Configure Number Variables
Configure settings for individual number variables in your model.
Required Editions
| Available in Salesforce Classic and Lightning Experience. |
| Available with CRM Analytics, which is available for an extra cost in Enterprise, Performance, and Unlimited Editions. Also available in Developer Edition. |
| User Permissions Needed | |
|---|---|
| To configure the number fields in a model: | Create and Update Einstein Discovery Models |
- On the Model Settings page, click a numeric variable.
- On the Alert tab, respond to any suggestions regarding data issues for this field. For more information, see Handle Quality Alerts.
-
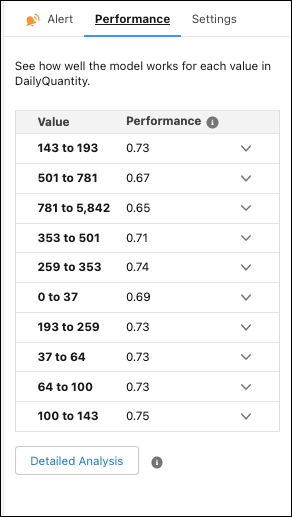
On the Performance tab, see how well your model works for each value within the
selected variable.
Performance is shown as a decimal score, where 1 is perfect accuracy. For example, in the variable DailyQuantity, values “143 to 193” have a performance score of 0.73, and values “501 to 791” have a score of 0.67. You can then conclude that the model performs better when the daily quantity is from 143 through 193 than when it’s from 501 through 791.
-
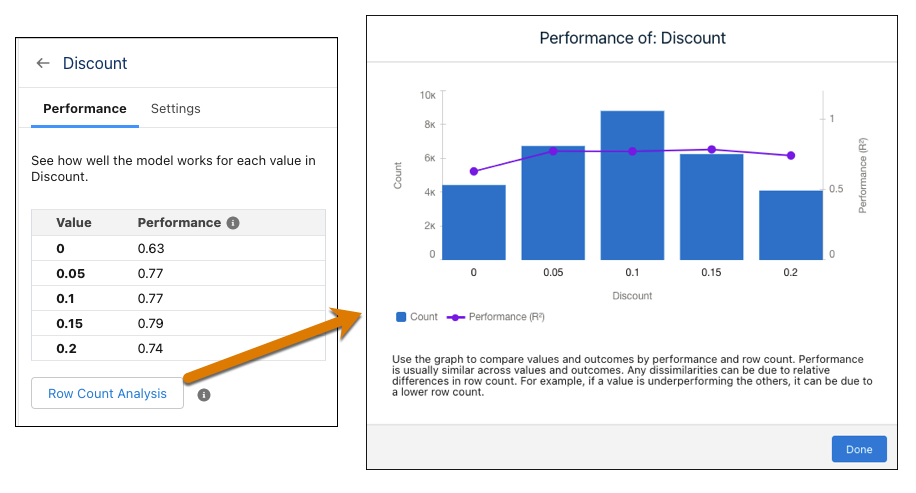
Optionally, if using a binary classification or regression model, click
Row Count Analysis to see a detailed comparison of the values
by performance and row count.
-
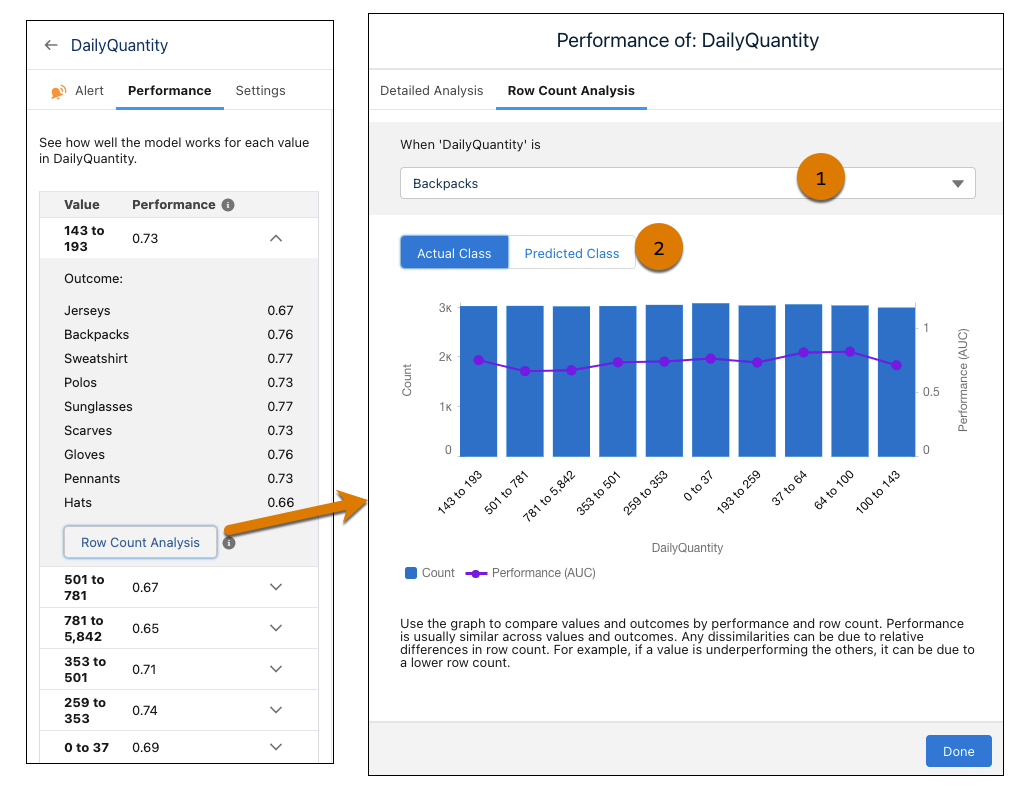
Optionally, if using a multiclass classification model, see the performance of each
value by outcome.
- To expand a value to see performance by outcome, click
 .
. - To see a graphic comparison of values and outcomes by performance and row
count, click Row Count Analysis.
- Use the dropdown to select different outcomes (1). The chart updates according to the selected outcome.
- Toggle between Actual Class and Predicted Class (2). The Actual Class groups data based on the observed value. The Predicted Class groups data based on the predicted value.
- To see a graphic comparison of values and outcomes by performance and row
count, click Row Count Analysis.
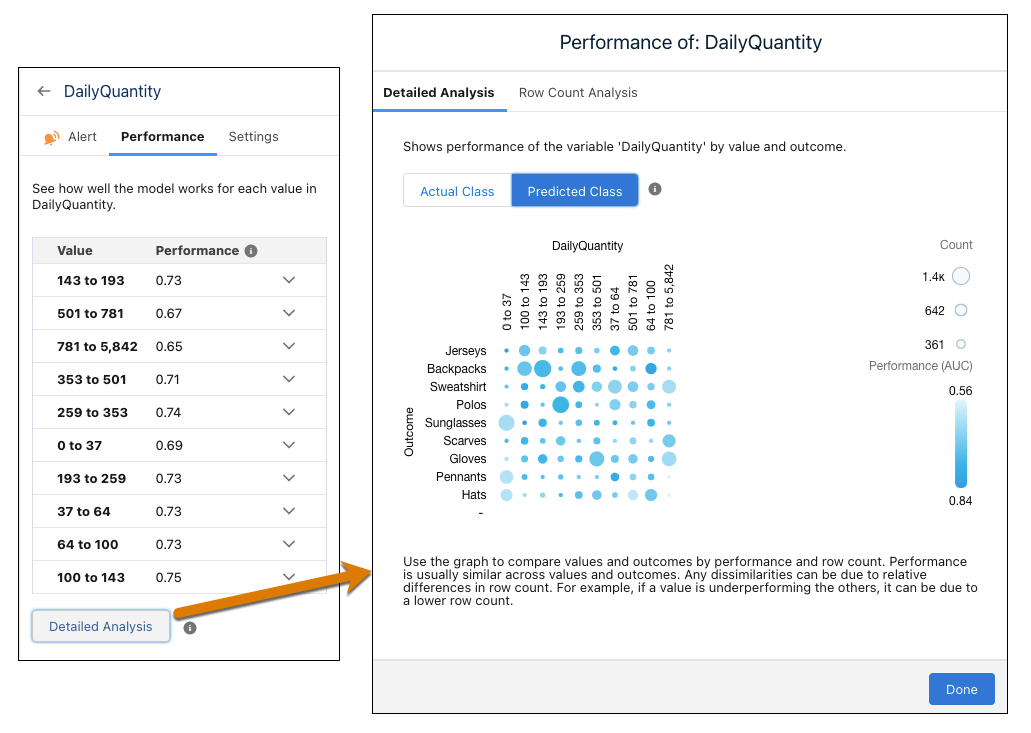
- To see a graph of performance by value and outcome, click Detailed
Analysis. The darker the circle, the better the performance. The
bigger the circle, the higher the row count.
- To expand a value to see performance by outcome, click
-
Optionally, if using a binary classification or regression model, click
Row Count Analysis to see a detailed comparison of the values
by performance and row count.
-
In the Settings tab, configure the following settings.
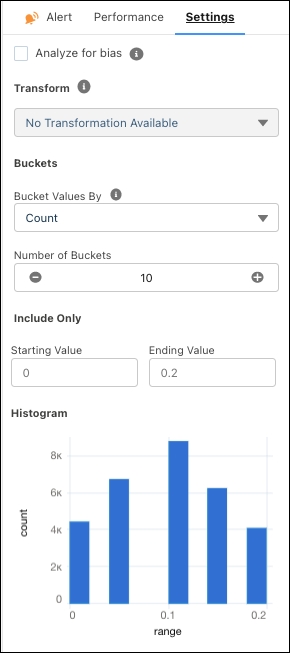
Setting Description Analyze for bias Select this option to exclude a variable from the model so that it doesn’t influence predictions and recommendations. If selected, Einstein Discovery shows a shield icon next to the title of the insight to remind you it’s a sensitive variable.

This enables you to evaluate and assess the field’s impact in the model. Einstein Discovery still notifies you if it shows a 50% or higher correlation to the model’s outcome variable.
Transform Select a transformation to apply data improvements.
- Replace Missing Values enables statistical
imputation and fills in missing values. Use this transformation to improve
model performance. See Replace Missing Numerical Values.
 Note Replace Missing Values influences the model generated during analysis but has no effect on the generated insights.
 - Projected Predictions allows you to provide
trending data that factor into your predictions to make them more accurate.
See Configure Projected Predictions.Note Projected Predictions influences the model generated during analysis but has no effect on the generated insights.
Bucket Values By Select how to bucket data.
Note A numeric variable with low cardinality (10 or fewer observations) is converted to a text variable. Einstein Discovery displays this value along the x-axis rather than in a range (bucket).Number of Buckets Specify the number of buckets to show in charts. Einstein Discovery automatically aggregates numbers into groups based on behavior. Include Only Create a numeric range by adding minimum and maximum values to the Starting Value and Ending Value fields. Histogram A bar chart graph shows the number of values that occur across the range of numbers. Changes take effect after you create the model.
- Replace Missing Values enables statistical
imputation and fills in missing values. Use this transformation to improve
model performance. See Replace Missing Numerical Values.
- Replace Missing Numerical Values
Einstein Discovery allows you to replace missing numerical values in your model. Use the Replace Missing Variables transformation to enable statistical imputation on a numeric variable. Einstein Discovery automatically replaces missing values with data derived from another subset of your data. - Configure Projected Predictions
Einstein Discovery allows you to provide trending data for numeric variables that factor into your predictions to make them more accurate. For example, you predict opportunity win/loss based on expected price fluctuations for raw materials. To factor price into your predicted outcome, use the Projected Predictions transformation and provide a dataset that projects the expected price for raw materials on the close date.