
You are here:
Select Data Options
Manually select and configure the variables in your dataset for Einstein to analyze and use to build a predictive model.
-
Use the table to select which variables to include in the model. Select at least 2, and
no more than 49, variables.
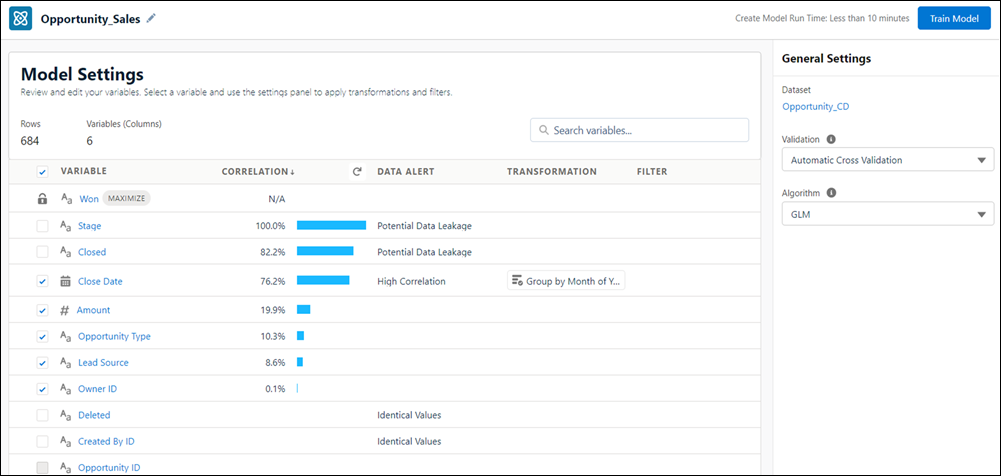
Column Description Selection Select the checkbox to include the variable in the model.
 Note The row with the lock icon indicates the model’s outcome variable, or target. It’s automatically included in the model. It can’t be deselected.
Variable Dataset column, or field. Also known as a feature variable. Each row represents a column in the dataset, and is marked as a number, text, or date variable.
Sort the table by variable in ascending or descending order by clicking the column header.
Note- The list of variables includes numeric, text, and date columns with at least 25 rows of data from the dataset.
- Multivalue fields, which are fields that contain multiple values (such as a list or array), aren’t supported in Einstein Discovery. To learn more, see Einstein Discovery Capacities and Requirements.
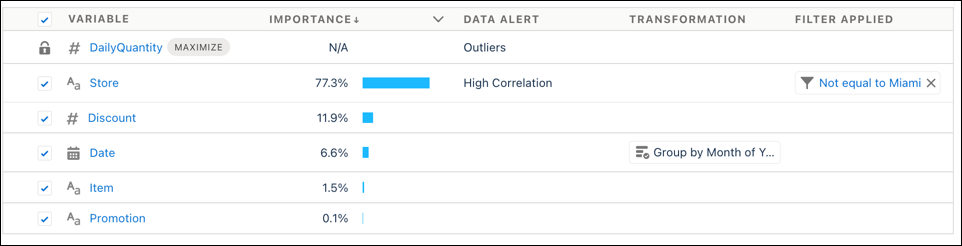
Importance or Correlation Einstein shows metrics to help you decide which variables to include. Correlation shows the strength of association between the variable and the outcome, and importance shows how much the model uses the variable when predicting the outcome. For example, when predicting energy usage, temperature might be the highest correlated, while air conditioner type is the most important.
To choose what you want to see, use the column’s dropdown menu.
- Importance shows how much the variable influences the outcome. Importance indicates the degree by which the model chooses to use the variable when predicting the outcome. The higher the importance, the greater the impact.
- Correlation shows how much the variable is associated with the outcome. The higher the correlation, the stronger the relationship between the variable and the outcome.
 Tip
Tip- Use these metrics to evaluate variables relative to one another. Consider top and bottom rather than absolute values.
- When importance and correlation are different, best practice is to consider importance. Importance is a more advanced metric that understands interactions between variables. For example, when predicting global sales, product and region may be weakly correlated individually, while together they’re highly important.
- If a variable has little or no importance or correlation, consider deselecting it to improve the model.
Data Alert Displays data alerts. Transformation Displays transforms, or configured changes. Filter Applied Displays excluded values. -
To configure settings for an individual variable, select it in the table and use the
right panel.
For each variable, Einstein uses up to 100 values. If the variable has more than 100 values, then the values that occur the most are used while the rest are grouped into Other. To increase the number of values used in a variable to 200, enable high cardinality. For more information, see High Cardinality Alert.
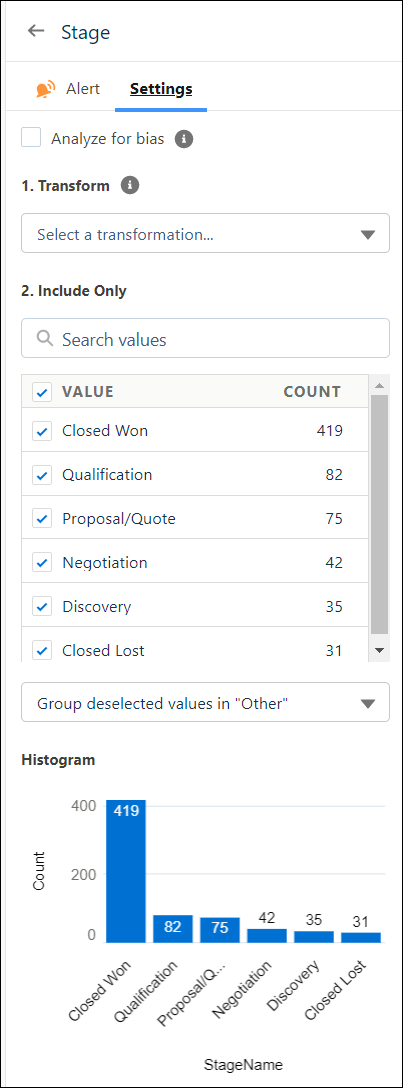
Tab Description Alert Identifies possible issues detected in the data, such as outliers or duplicates. Review alerts and recommended actions to get better insights, predictions, and improvements. To learn more, see Handle Quality Alerts. Settings Analyze for bias—select to subject the text variable to bias detection so you can remove distorting or unethical effects on your analysis and predictions. To learn more, see Detect and Remove Bias from a Model.
Transform—Use transforms in the variable’s settings to improve data for analysis. Transformations affect the model, and don’t impact the dataset.
Note When applied, transformations use all values in the variable from the dataset.For instructions, see
Buckets—For numeric variables.
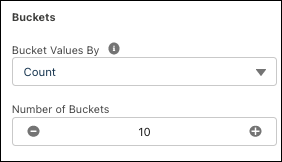
- Choose a bucketing method with the Bucket Values
By dropdown.
- Count: Buckets proportionally by occurrence.
- Width: Buckets proportionally within the total range of values.
- Manual: Specify your own bucket ranges.
- Select the number of buckets.
Include Only—Displays values in the variable, including its label and row count. Values that occur fewer than 25 times are grouped as “Other.”
- To group or bucket values as other, deselect them and choose Group deselected values in “Other” in the dropdown.
- To filter out values, deselect them and choose Exclude deselected values in the dropdown.
Tip Apply filters after transformations. Transformations ignore excluded value filters.Histogram—Chart displays distribution of the values by occurrences, or row count.
- Choose a bucketing method with the Bucket Values
By dropdown.
-
Configure General Settings in the right panel.
- Choose an Algorithm for Einstein Discovery to use to create
the model with.
Algorithm Description GLM Default. Generalized Linear Model is a regression-based algorithm. GBM Gradient Boost Machine is a decision tree-based ensemble machine learning algorithm. XGBoost XGBoost is a decision tree-based ensemble machine learning algorithm. Random Forest Random Forest is a supervised learning algorithm that uses multiple decision trees, randomization, and other optimization techniques. Model Tournament Alternatively, have Einstein Discovery run all four algorithms and then use the algorithm that performed best. - Optionally, make a selection from the Validation Option dropdown to specify if you want to specify a validation set. To learn more, see Edit General Settings for a Model.
- Choose an Algorithm for Einstein Discovery to use to create
the model with.
- Click Create Model.