
You are here:
Configure Text Variables
Configure settings for individual text variables in your model.
Required Editions
| Available in Salesforce Classic and Lightning Experience. |
| Available with CRM Analytics, which is available for an extra cost in Enterprise, Performance, and Unlimited Editions. Also available in Developer Edition. |
| User Permissions Needed | |
|---|---|
| To configure text fields in a model: | Create and Update Einstein Discovery Models |
-
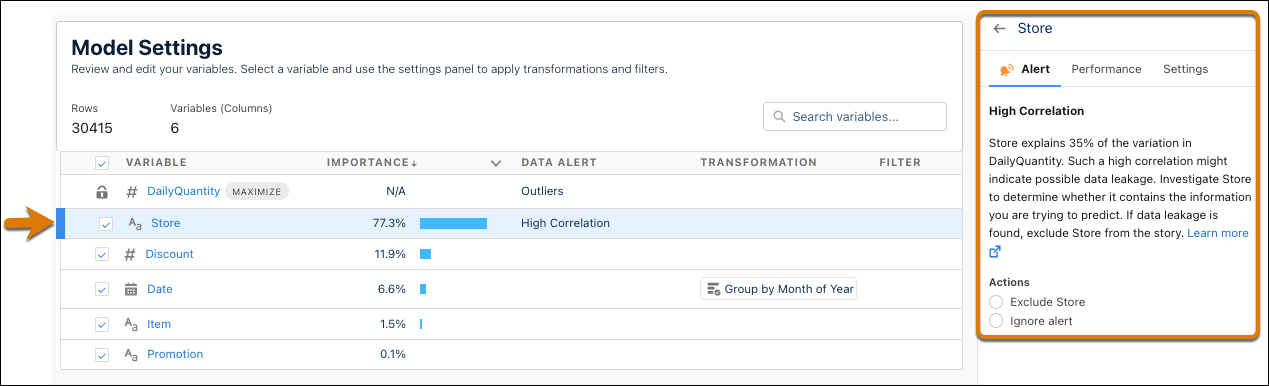
On the Model Settings page, click a text variable. The variable panel appears.
-
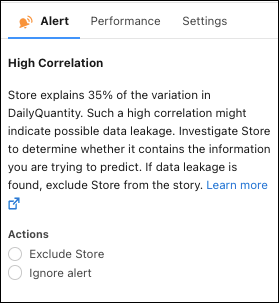
In the Alerts tab, respond to any suggestions regarding data
issues for this field, such as high correlation, strongest predictors, or missing values.
For more information, see Handle Quality Alerts.
-
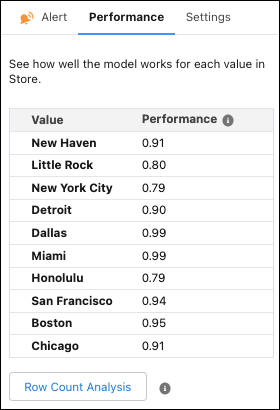
In the Performance tab, see how well your model works for each
value within the selected variable.
Performance is shown as a decimal score, where 1 is perfect accuracy. For example, in the variable Store, Miami has a performance score of 0.99, and Honolulu has a score of 0.79. You can then conclude that the model performs better for the Miami store than the Honolulu store.
-
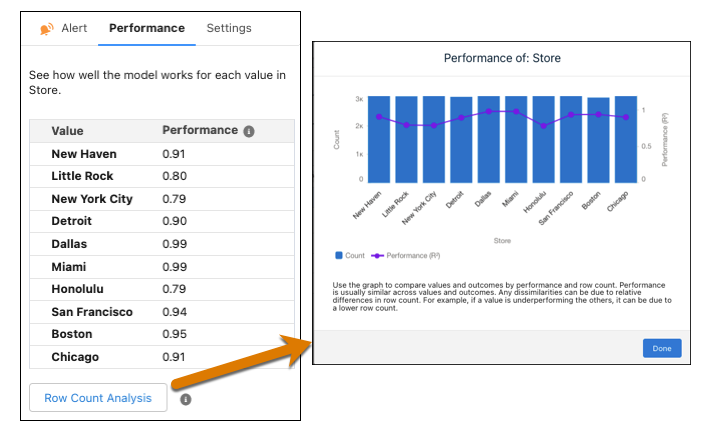
Optionally, if using a binary classification or regression model, click
Row Count Analysis to see a detailed comparison of the values
by performance and row count.
-
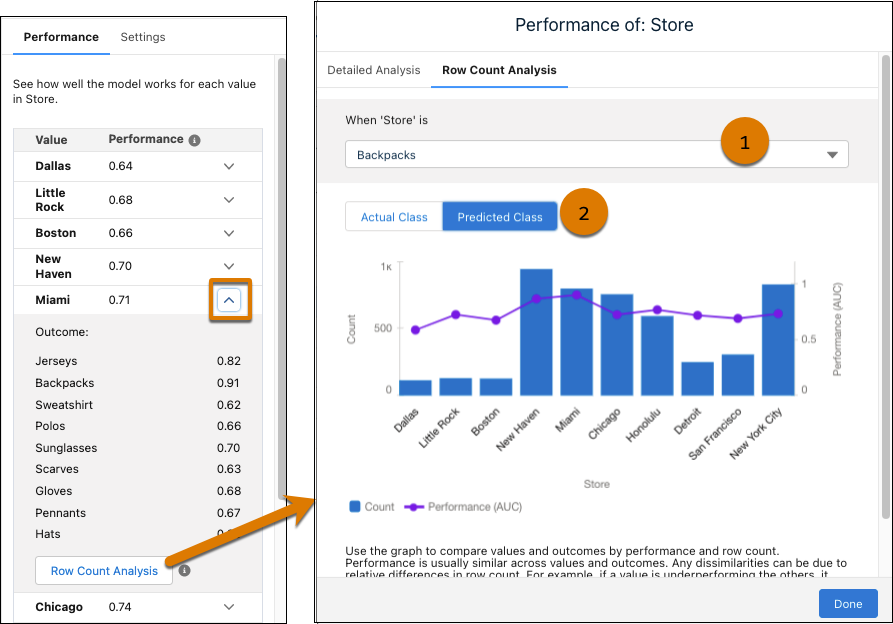
Optionally, if using a multiclass classification model, see the performance of each
value by outcome.
- To expand a value to see performance by outcome, click
 .
. - To see a graphic comparison of values and outcomes by performance and row
count, click Row Count Analysis.
- Use the dropdown to select different outcomes (1). The chart updates according to the selected outcome.
- Toggle between Actual Class and Predicted Class (2). The Actual Class groups data based on the observed value. The Predicted Class groups data based on the predicted value.
- To see a graphic comparison of values and outcomes by performance and row
count, click Row Count Analysis.
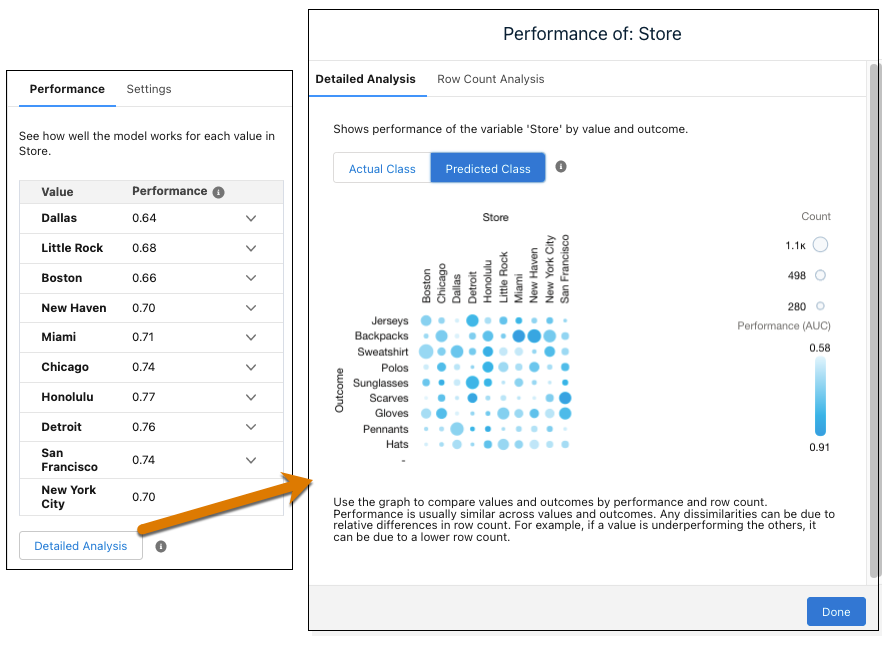
- To see a graph of performance by value and outcome, click Detailed
Analysis. The darker the circle, the better the performance. The
bigger the circle, the higher the row count.
- To expand a value to see performance by outcome, click
-
Optionally, if using a binary classification or regression model, click
Row Count Analysis to see a detailed comparison of the values
by performance and row count.
-
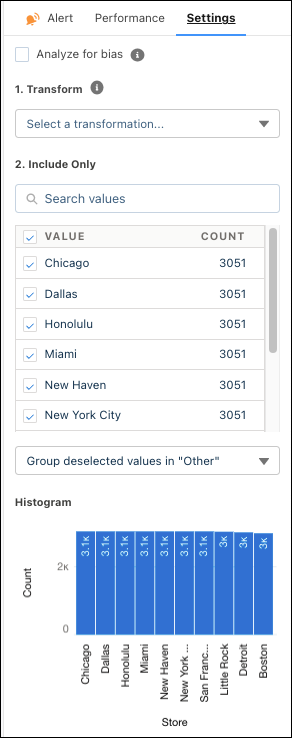
In the Settings tab, configure the following settings.
Setting Description Analyze for bias Select this option to exclude a variable from the model so that it does not influence predictions and recommendations. If selected, Einstein Discovery shows a shield icon next to the title of the insight to remind you it’s a sensitive variable.

This option allows you to evaluate and assess the variable’s impact in the model. Einstein Discovery still notifies you if it shows a 50% or higher correlation with the model’s outcome variable.
Transform Select the method to transform your text:
- Fuzzy Matching to resolve spelling variations. See Apply Fuzzy Matching for Smarter Categorizations.
- Detect Sentiment to categorize unstructured data. See Detect Sentiment in Unstructured Text.
- Text Clustering to bucket unclustered data by keywords. See Use Text Clustering to Analyze Unstructured Data.
- Replace Missing Values to fill in missing values. See Impute Missing Text Values.
Include Only Select the values you want to include in the model. Depending on the following options, excluded values are either omitted from analysis or merged into the Other category. Histogram A bar chart graph shows the number of values that occur across values. Changes take effect after you create the model.
- Apply Fuzzy Matching for Smarter Categorizations
Fuzzy matching adds uniformity to spelling variations in variables, resulting in smarter categorizations and better predictions. Einstein Discovery transforms the data at prediction time, enabling you to skip cleansing during data prep. - Detect Sentiment in Unstructured Text
Process unstructured data during model creation and categorize sentiment as positive, negative, or neutral. - Use Text Clustering to Analyze Unstructured Data
Text clustering reduces unstructured data to its top keywords and enables you to quickly reveal hidden insights and improve decision making. - Impute Missing Text Values
Einstein Discovery allows you to impute missing text values in your dataset. Enable imputation on a text variable, and Einstein Discovery automatically replaces missing values with data derived from another subset of your data.