You are here:
Get Predictions in Tableau Dashboards
Integrate on-demand, interpretable predictions from Einstein Discovery natively in Tableau dashboards. With the Einstein Discovery dashboard extension, you can embed dynamic predictions in worksheets and explore “what if” prediction scenarios with parameters.
Tableau Documentation for the Einstein Discovery Dashboard Extension
This topic provides an overview of the Einstein Discovery Dashboard Extension. For detailed instructions on setting up and using the extension in Tableau dashboards, refer to the following topics in Tableau Desktop help:
Tableau Source Data
In Tableau, there are two types of sources of data you can use with the extension:
- Worksheets allow you to get predictions for one or more rows of data (bulk predictions). You can get bulk predictions for up to 50,000 rows of data at a time.
- Parameters allow you to conduct interactive, “what if” predictive analysis on a single set of input values.
The source data you use in Tableau—whether in a worksheet or in parameters—must provide all the data elements that the Einstein Discovery prediction requires to predict the outcome you want. The data must match the granularity that the Einstein Discovery prediction expects. For example, if the prediction expects sales per individual order, then your Tableau data must be in the form of individual orders, not aggregated into monthly totals for all orders.
Use the Einstein Discovery Dashboard Extension in Tableau Dashboards
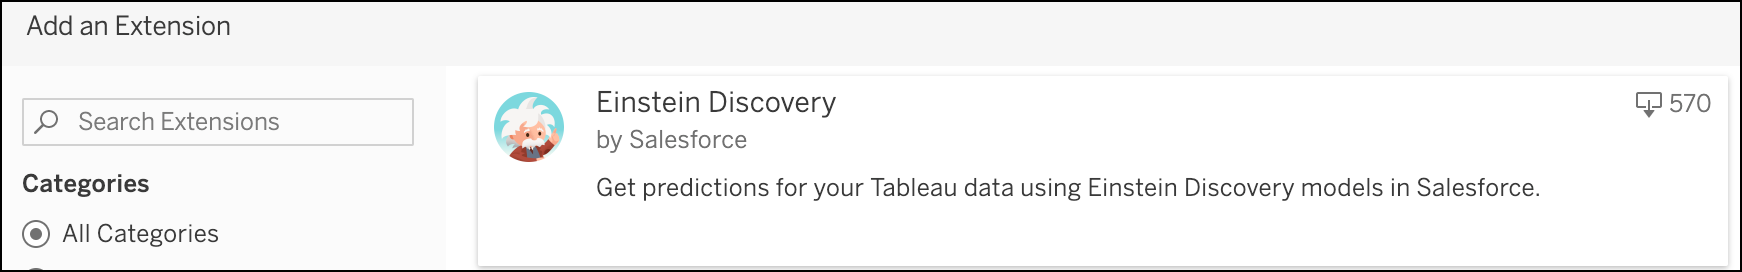
In Tableau, as an author, create worksheets and the dashboard, and then add the Einstein Discovery dashboard extension to the dashboard.
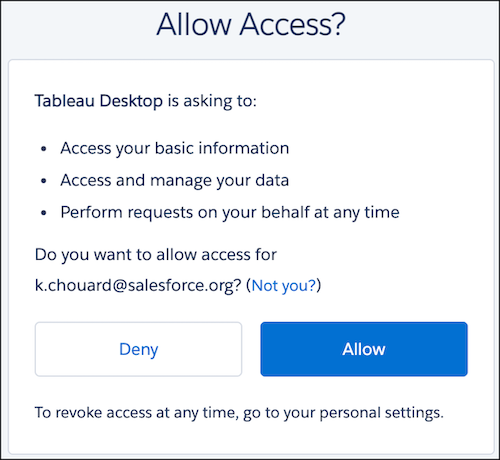
When configuring or using the extension, if prompted, log into Salesforce and allow access from Tableau.
Next, configure the extension by selecting a deployed Einstein Discovery prediction definition and data source details.
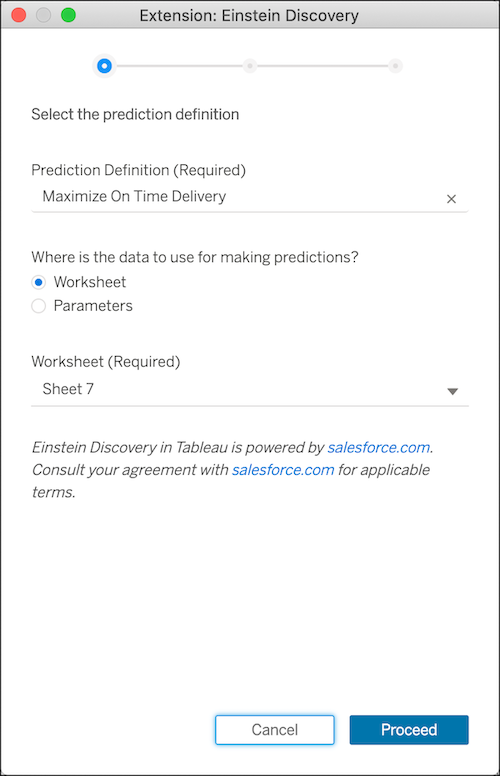
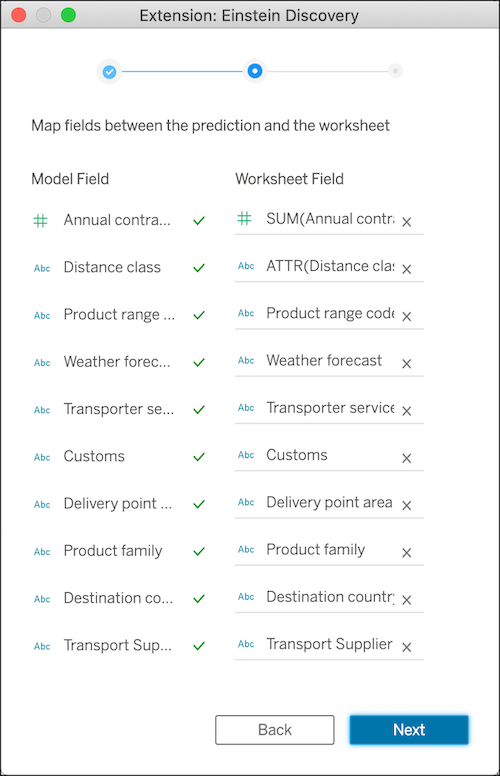
Map model fields to source data in the dashboard.
Configure other settings, if you want, such as whether to retrieve top predictors and improvements.
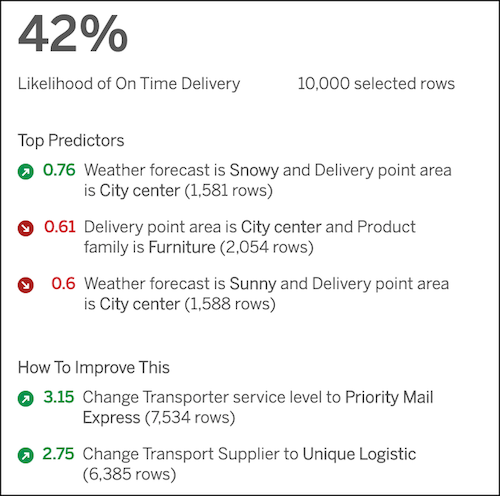
After the settings are configured, dashboard viewers and users can click different marks in the Tableau visualization to explore predictions on the underlying data. Here’s an example Einstein Prediction panel.