
You are here:
Embed Dashboards in Lightning Pages
Add LWC or Aura CRM Analytics dashboards to Lightning home pages, record pages, and app home pages to provide interactive visualizations of your data. Users can drill down and explore the dashboard within a Lightning page.
Required Editions
| Available in: Lightning Experience |
| Available in: Professional, Enterprise, Performance, Unlimited, and Developer Editions |
| User Permissions Needed | |
|---|---|
| To view embedded CRM Analytics dashboards: | CRM Analytics Growth permission set license with Use CRM Analytics permission |
| To create and save Lightning pages in the Lightning App Builder | Customize Application |
| To view Lightning pages in the Lightning App Builder | View Setup and Configuration |
To learn more about embedding dashboards for mobile users, see Integrate Dashboards Into Your Mobile Users’ Workflow.
Go to an existing Lightning Experience page, select the wheel icon at the upper right, then click Edit Page. Or, go to Lightning App Builder, click New, and follow the prompts to create a Lightning page. Then, follow these instructions to embed a dashboard in the page.
-
In the list of components, select LWC CRM Analytics
Dashboard.
 Note You can still use the Aura CRM Analytics Dashboard component, but starting in Summer `24, we recommend using the LWC component for seamless Lightning integration.
 -
From the Dashboard dropdown list, select the dashboard to display.
Note (For Developers) In the code, the
developerNameattribute is used for the dashboard name. If configuring the component programmatically, you can use either thedeveloperNameattribute or thedashboardIdattribute. The developerName can be requested through the API. ThedashboardIdis the 18-character code beginning with0FKthat is found in the URL when viewing a dashboard. - From the layout dropdown list, select the type of screen where your Lightning page is viewed.
-
Configure the attributes of the embedded CRM Analytics dashboard.
Attribute Description Height Specify the height of the dashboard in pixels. The default is 300. Include Share and Download Options Allow users to share and download dashboard images and data. When this option is selected, the Share control is added in the header of the dashboard and both Share and Download actions are added in dashboard widget menus. Requires a minimum dashboard height of 612 pixels, plus user access to image sharing and downloading data. The default is false. Show Title Control the visibility of the dashboard title. When this option is selected, the dashboard’s title appears above the dashboard. The default is true. Show Header Control the visibility of the dashboard header. When this option is selected, the dashboard is displayed with a header bar that includes the Open in Analytics icon, the date and time that the dashboard’s data was updated, and the dashboard views menu. The header bar also appears if either Show Sharing Icon or Show Title is selected. Open Dashboard Specify where the dashboard opens when users click the open icon. The default behavior is to open the dashboard in the CRM Analytics Studio. Other options include opening the dashboard in the Salesforce Lightning Analytics tab or disabling the open icon. Open Links in New Windows (Aura Component only) Specify where links from the dashboard to other assets are opened. When this option is selected, links open in new windows. When this option isn’t selected, links open in the same window. The default is true. Hide On Error (Aura Component only) Use Set Component Visibility instead. Enable Notifications Allow users with permission to set conditions and get notified about updates to dashboard widgets. And when Show Header is true, this option also surfaces the notifications icon in the dashboard header, which opens the notifications management panel for editing and deleting notifications. If you enable Show Header, it’s recommended that the dashboard is at least 400 pixels in width to accommodate the management panel. Enable Subscriptions Allow users with permission to subscribe for periodic email updates on dashboard widgets. And when Show Header is true, this option also surfaces the subscriptions icon in the dashboard header, which opens the subscriptions management panel for editing and deleting subscriptions. If you enable Show Header, it’s recommended that the dashboard is at least 400 pixels in width to accommodate the management panel. Set Component Visibility Dynamically controls whether users see a dashboard. To set the visibility for the dashboard component, add filters. For example, add a filter of Permissions > Standard Permissions > Use CRM Analytics Equal true to show the dashboard component to users with CRM Analytics permissions only. For more information on component visibility, see Dynamic Lightning Pages. Filter (LWC Component only) Add selections or filters to the embedded dashboard at runtime. You can filter dataset fields by variables or specified values. Specify filters by entering JSON strings in the Filter text box. For examples, see Filter and Selection Syntax for Embedded Dashboards. If a filter or selection can’t be applied, the attribute is ignored and the dashboard appears with all its data and no selection. Dashboard Filters (Aura Component only) Add selections or filters to the embedded dashboard at runtime. You can filter dataset fields by variables or specified values. Specify filters either by using the point-and-click Filter Builder (record pages only) or by entering JSON strings in the Filter String box. For examples, see Filter and Selection Syntax for Embedded Dashboards.
Use the Filter Builder to set up a dashboard to show the contextual data for each record page in which it appears. Click Filter Builder and + Add Dashboard Filter. Select a dataset, dataset field, and operator. Then click Select to specify a field in an sObject or custom object.
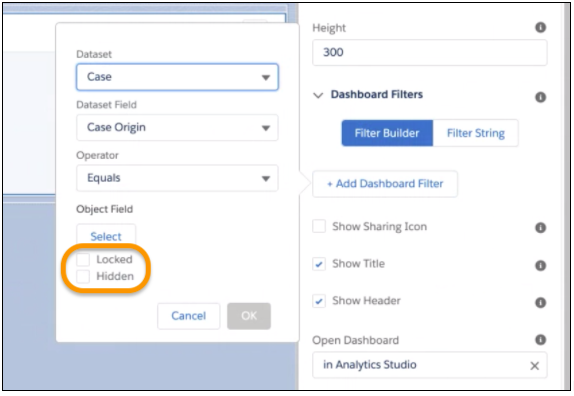
Prevent users from exposing more data by locking or hiding filters. With the Locked option, the Filters menu appears in the embedded dashboard header, but users can’t modify or delete the filters. With the Hidden option, the Filters menu doesn’t appear in the embedded dashboard header.
When you click OK, the filter appears in the configuration panel.
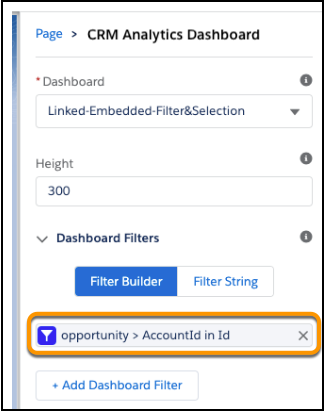
Click an existing filter to edit it in the Filter Builder, or click X to remove it. To view or edit the filter JSON, click Filter String.
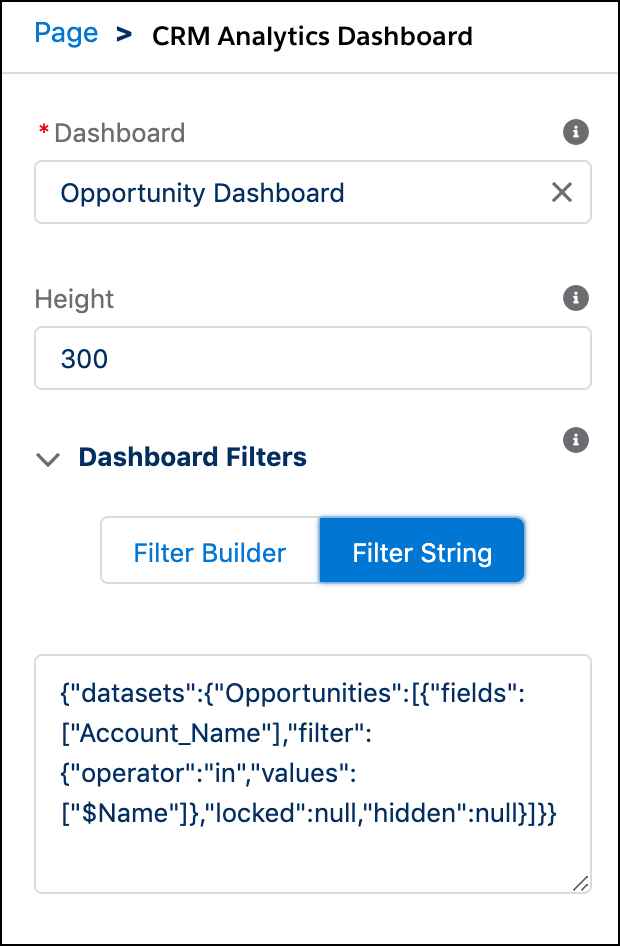 Note For the Filter Builder, the dataset fields must be dimensions (not dates or measures), and the object field values must be tokenizable (not static values). If a filter is created or edited in the Filter String text box, it can't be viewed or edited in the Filter Builder. If a filter or selection can’t be applied, the attribute is ignored and the dashboard appears with all its data and no selection.Note
When setting up locked or hidden filters for embedded dashboards, keep in mind the following considerations.
- Locked and hidden filters are applied on the dashboard. If a filter makes a field visible, users see the field even when you’ve restricted access to filters with one of these options.
- Locked and Hidden options aren’t automatically applied in linked dashboards or lens explorations. The options are applied only on the dashboard where specified.
- Locked and Hidden options are applied to a dashboard when embedded or when opened in CRM Analytics Studio or in the Analytics tab.
- When locked or hidden filters are applied to the dashboard, the My Views menu isn’t visible to users.
- Click Activation, and select the custom record page assignment.
- Save your changes.
For information about working with the Lightning App Builder, start on the Lightning App Builder overview page.