
You are here:
Converse with Your Data
Ask data questions using non-technical language, and view answers in automatically configured charts. Start with a common word or two, and CRM Analytics provides relevant suggestions that you can accept or edit.
To start a conversation:
-
For a dashboard, open the conversations panel by selecting
Conversations from the dropdown menu in the icon bar. For a lens,
locate the text entry box with the
 icon.
icon.
- Click in the text entry box.
- Select a suggestion, or type your own question.
-
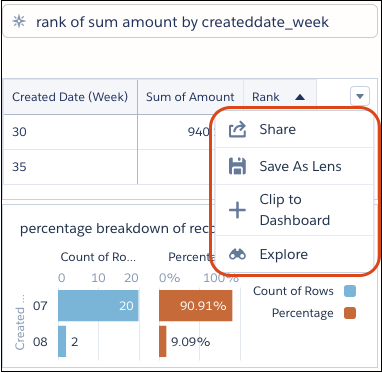
(Optional) When you have the chart that answers your question, click an action icon or the
dropdown menu in the upper right corner. Available actions, such as clip, explore, save, and
share, depend on the context.
 How does it work? The conversational auto-suggestions are based on fields in the available datasets. To see which datasets are open for conversational exploration, look for the purple hexagons (
 ). For a lens, click
Fields to view the available fields to ask about. For a dashboard, if
the suggestions don’t include the words you expect, click Add Dataset to
expand your exploration.
). For a lens, click
Fields to view the available fields to ask about. For a dashboard, if
the suggestions don’t include the words you expect, click Add Dataset to
expand your exploration. What kinds of questions can you ask? Question are built with measures and dimensions from your data combined with keywords, such as “show me” and “by.” Typically, measures are aggregated and dimensions are grouped to show meaningful information. Filters are applied to narrow the focus of the question.
Example Conversational Queries
Aggregations and Limits Measures Dimensions Filters top 3 account owner average CSAT this week (Created Date) bottom 5 amount by account owner and stage for closed equals (true) unit price and shipping cost by product family between 10000 and 100000 show me industry agent and case origin percentage change by segment previous cy (Close Date) revenue, csat by agent, state, product percentage breakdown of amount by opportunity name rank number of records by industry for industry equals (Agriculture, Biotechnology, Communications) max number for account type contains (cust) and amount > 10000 What if my question doesn’t include a measure? When no measure is specified, the response is aggregated by count of rows.
What if I don’t get a chart? Sometimes your question isn’t phrased properly and you see a red error message. In that case, try using the auto-suggestions to help rephrase your question. Sometimes you’ve asked a valid question but no results are returned. Try a wider filter or a different group. For more about what to type, see the following tables.
Elements of Conversational Exploration
| Question Elements | Keywords and Symbols |
|---|---|
| Measures (numerical or aggregated) | count, number, sum, avg, max, min, median, first, last, unique, top, bottom, stddev, stddevp, var, varp, percentage breakdown, percentage change, rank |
| Groups | by, and |
| Filters | (By dimension values) for, in/equals, not in/not equals, contains, top, bottom, without, filter out, exclude (for multiple values, use commas and parentheses, for example “(v1, v2, v3)”) (By measure ranges) with, equal, =, greater than, >, less than, <, between, top, bottom (By relative date ranges) today, tomorrow, yesterday, current/next/previous/last, year, quarter, month, week, day (for full list, see Relative Date Filters) |
| Question words | show me, show the, what is, what are |
| Shortcuts that depend on your dataset | deal, lead conversion, time to close, win rate (for more information, see Shortcuts) |
| Relative date units | Keywords |
|---|---|
| Fiscal Year | Current FY, Previous FY, Previous 2 FY, 2 FY Ago, Next FY, Current and Previous FY, Current and Previous 2 FY, Current and Next FY |
| Fiscal Quarter | Current FQ, Current and Next FQ, Current and Previous FQ, Next FQ, Previous FQ, Current and Next 3 FQ |
| Calendar Year | Current CY, Previous CY, Previous 2 CY, 2 CY Ago, Next CY, Current and Previous CY, Current and Previous 2 CY, Current and Next CY |
| Calendar Quarter | Current CQ, Current and Next CQ, Current and Previous CQ, Next CQ, Previous CQ, Current and Next 3 CQ |
| Calendar Month | Last Month, This Month, Next Month, Current and Previous Month, Current and Next Month |
| Calendar Week | Last Week, This Week, Next Week |
| Day | Yesterday, Today, Tomorrow, Last 7 Days, Last 30 Days, Last 60 Days, Last 90 Days, Last 120 Days, Next 7 Days, Next 30 Days, Next 60 Days, Next 90 Days, Next 120 Days |
| Keywords | Functions | Requirements | Examples |
|---|---|---|---|
| deals | sum Amount by opportunity Name | Opportunities dataset that includes “name” dimension and “amount” measure | “top 10 deals last month” or “show me deals that have moved out this quarter (createdDate)” |
| lead conversion rate | total leads divided by converted lead ("isConverted"=true) | Leads dataset that includes "IsConverted" dimension | “lead conversion rate by rep last month (Created Date)” |
| closed, won, lost (filters) | "isClosed"=true; “isWon”=true; “isWon”=false | Opportunities dataset that includes “isClosed” and “isWon” | “amount won last month (Close Date)” |
 ).
).Take the following into consideration:
- Conversational exploration requires the CRM Analytics Platform permission set license. It isn’t available in embedded dashboards, mobile apps, Experience Cloud sites, or standalone CRM Analytics apps, such as the Sales Analytics app.
- Admin setup is required.
- Conversational exploration is available only in the dashboard designer, the lens, and running apps.
- Some advanced functions aren’t supported.
- The time zone feature isn’t supported.
- If you have more than one dataset open in lens mode, conversational exploration is disabled.