You are here:
Window Functions Available in the Compare Table
The compare table's function menu provides UI-based access to useful window functions, saving you the time of having to write them in SAQL. Once you choose a function, you can edit the generated SAQL in the formula editor.
Sliding Window
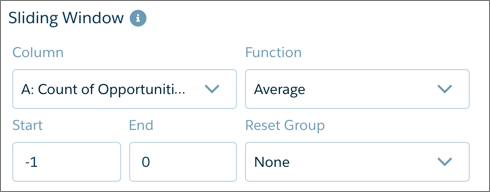
Applies an aggregate function to the current row with respect to a configurable range of rows. The function can be reset on a grouping defined in the table. Use the sliding window for calculating values such as running totals and moving average.
Percentage of Group
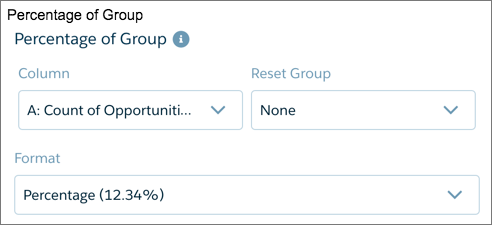
Calculates the percentage each row is of its group total, or of the grand total. The function can be reset on a grouping defined in the table.
Rank Within Group
Provides rank, dense rank, cumulative distribution, and row-number functions. Ranking can be reset on a grouping defined in the table.
The Order menu determines the direction of ranking based on the values being ranked. Ascending ranks the lowest value as number 1, while descending ranks the highest value as number 1.
Period Over Period
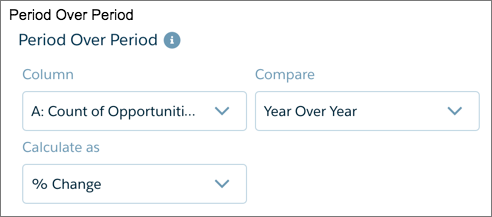
Compares periods of time to calculate changes in values. For example, year-over-year sales, or quarter-over-quarter closed opportunities, can be calculated by choosing the column and setting the granularity of the time period.
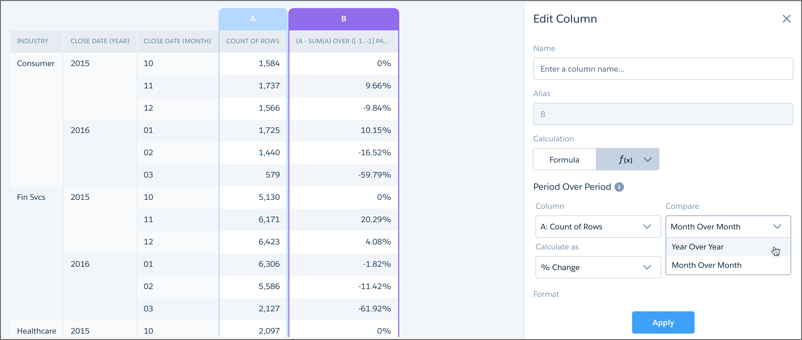
Always group data by year first, then (optionally) grouped by a finer granulation of time if available. Compound dates, if available, can be used directly with the period-over-period function. Examples of compound dates include “2016-01” (month of January 2016) and “2016-1” (first quarter of 2016). Comparisons can be shown as percentages or units.
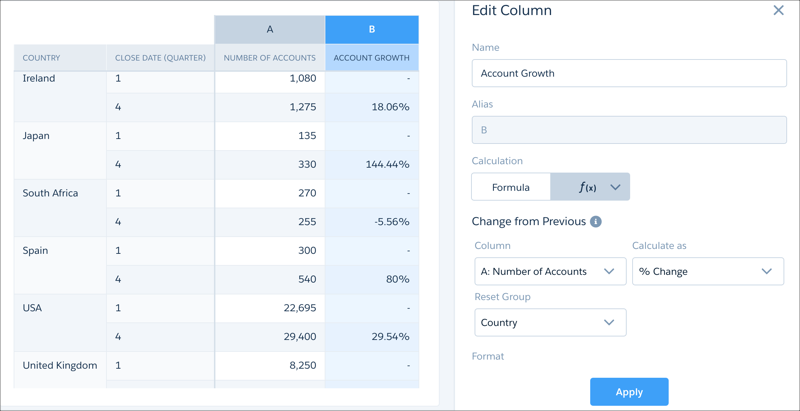
Change from Previous
Compares the value of the current row with that of the previous row and calculates the difference. For example, to calculate the growth in number of accounts between the first and fourth quarters, choose the column showing number of accounts from Column. To restrict that calculation to each country, choose the country column from Reset Group.
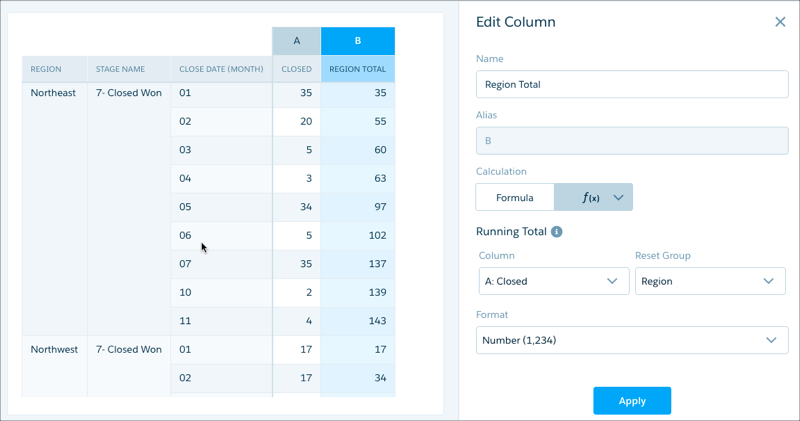
Running Total
Calculates the total value of the current row summed with all previous rows. For example, to calculate the monthly total of closed opportunities as a running total, choose the column showing closed opportunities from Column. To calculate that running total within each region, choose the region column from Reset Group.