
You are here:
Add Custom Formulas to Columns
Use the column editor to define custom formulas in compare tables or charts. View measures side by side, and perform math across the table’s columns and rows. Use string values to create labels, concatenate dimension values, provide simple buckets, or add image URLs.
Required Editions
| Available in Salesforce Classic and Lightning Experience. |
| Available with CRM Analytics, which is available for an extra cost in Enterprise, Performance, and Unlimited Editions. Also available in Developer Edition. |
| User Permissions Needed | |
|---|---|
| To view visualizations: | Use CRM Analytics |
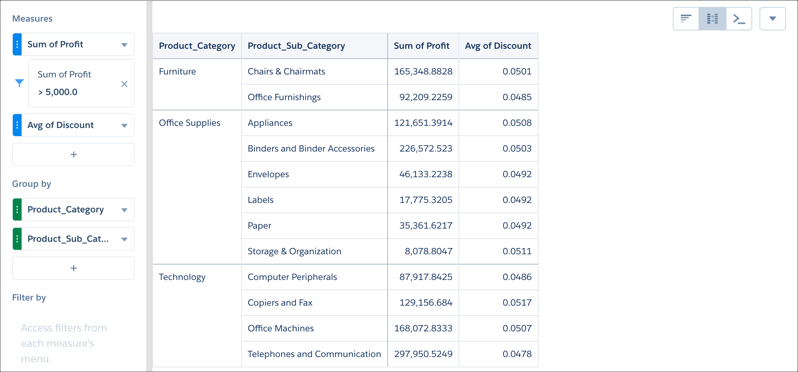
- In the lens, click the Table Mode icon and select Compare Table.
-
On the Data tab, click
 under Measures.
-
Add dimensions by clicking in the Group by panel.
Null values that occur in the data are displayed as minus signs (-).
-
Change the first measure by clicking the initial selection (Count of Rows). Add more
measures by clicking under Measures in the Data tab.
-
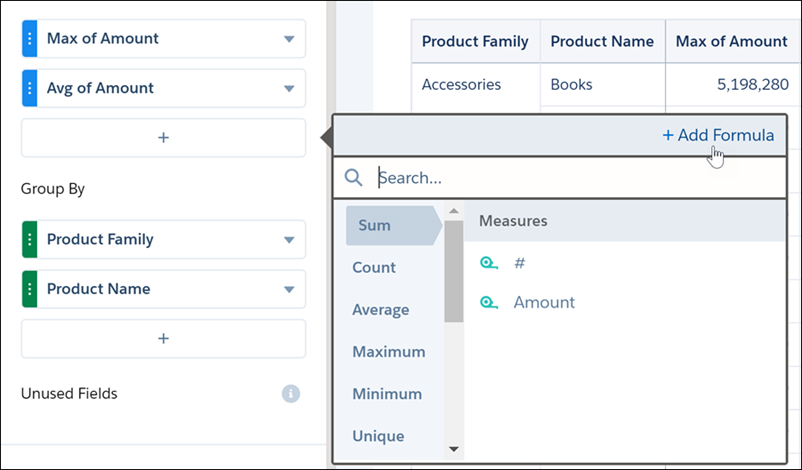
To enter a custom formula, click under Measures and click
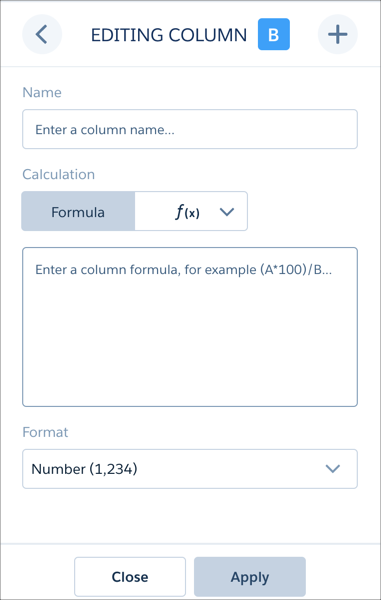
Add Formula. In the column editor, you can enter text string formulas, SAQL formulas, including math functions, or choose a windowing function to calculate the values in the column. You can also name the column and choose a number format. If a formula contains division by 0, the result is displayed as a minus sign (-).
 If you want to preserve an existing column, select Clone Column from the original column's action menu. You can edit the cloned column instead of the original.
 -
In the Formula field, create formulas using these operators.
Symbol Examples Calculation + A+B, A+100 Addition, applied per row. - A-B, A-100 Subtraction, applied per row. / A/B, A/100 Division, applied per row. * A*B, A*100 Multiplication, applied per row. ( ) (B-A)/(A*100) Parentheses for grouping operations. Dimension columns are on the left and measure columns are on the right. The measure columns are identified in formulas as A, B, C, and so on, with A being the far-left measure column.
You can also create string formulas. For example, this formula creates simple buckets.
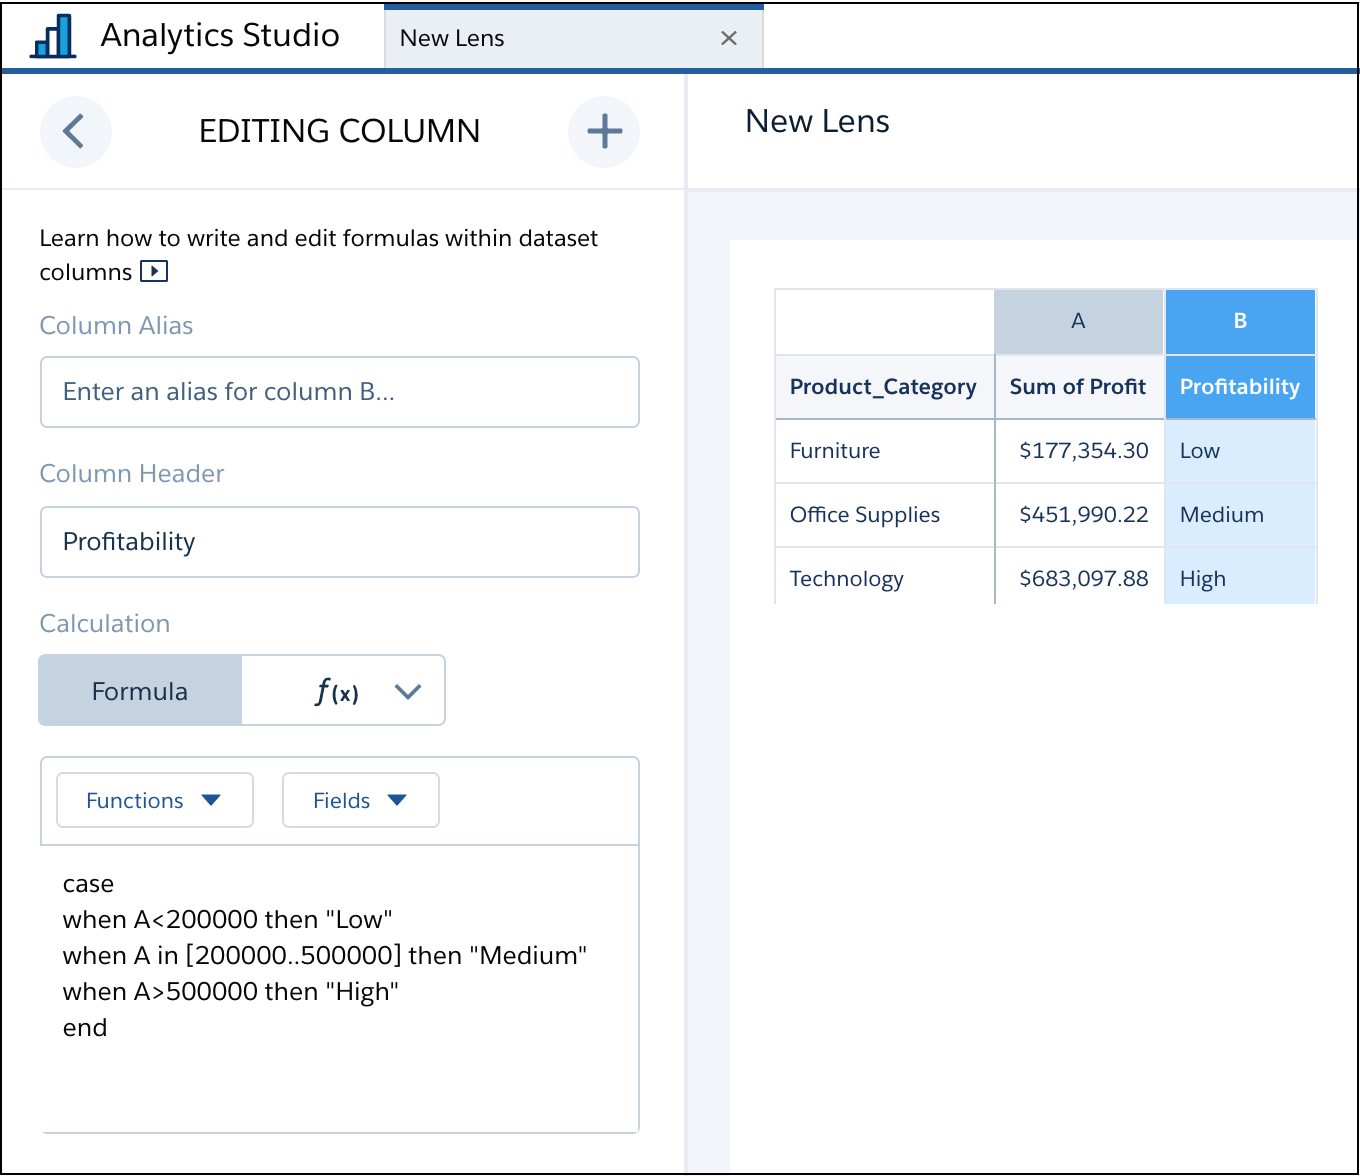
You can’t use columns based on string formulas as dimensions for grouping in charts, but you can use them to apply conditional formatting in charts.
-
To use SAQL, enter it directly into the formula editor, and click
Apply to see the result.
See the CRM Analytics SAQL Developer Guide for more information on writing SAQL.
Some SAQL functions can’t use letter references for columns, such as A, B, C. The
percentile_descandpercentile_contfunctions, for example, require raw field names as arguments. See Use Raw Field Names in Query Formulas for more information.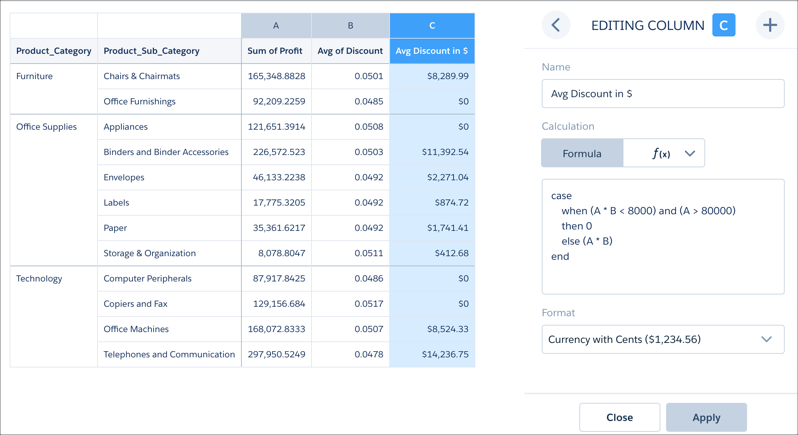
-
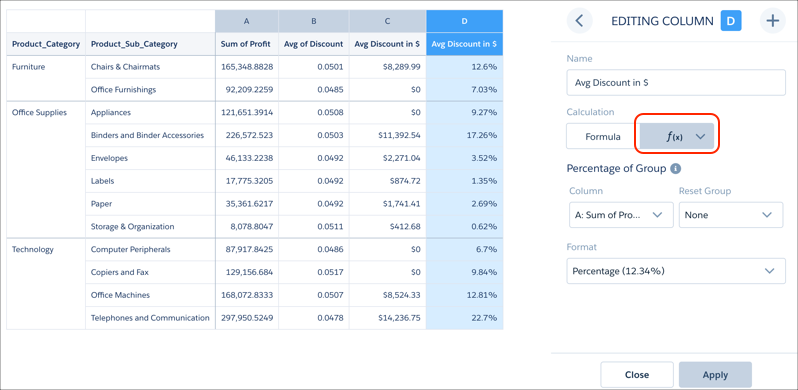
To use a function, choose the function editor and then choose a windowing function from the
menu. After you configure the function, click Apply to see the
result.
 Switch to the formula editor to see the SAQL generated by the chosen function. You can edit the SAQL in the formula editor after generating it with a function as if you’d written it.
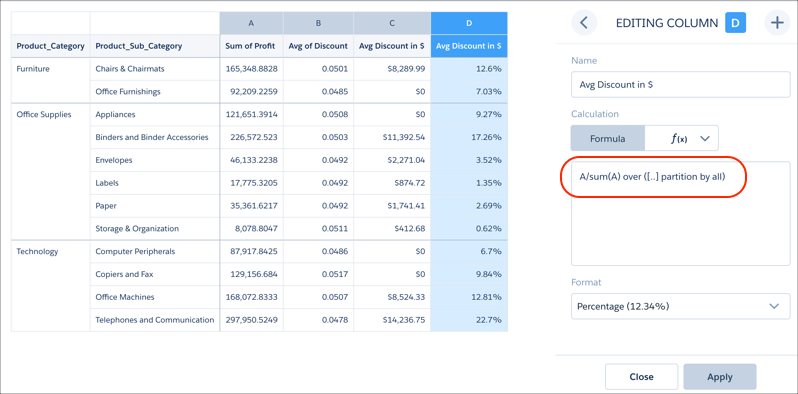
Filters on formula columns aren’t supported.
-
To open a column's action menu, click the down arrow.
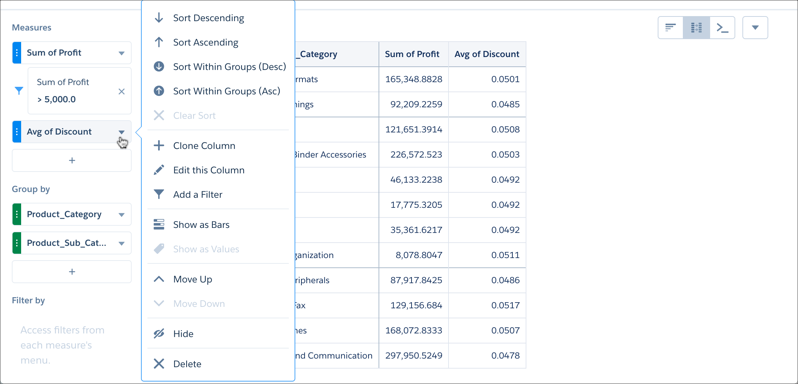
- To change a column's name or formula, click Edit this Column.
Numeric formats use the period as a decimal separator and the comma as a grouping symbol. The currency formats are restricted to dollars and cents.