
You are here:
Explore Multiple Datasets with a Single Query
Answers to business questions sometimes require context beyond the current dataset. Or, your dataset structure may not match the way you want to explore your data. To surface insights that require data from disparate datasets, blend the data from multiple datasets in a lens. Then query the blended data just as you would with a single dataset.
Data blending differs from a join operation in that data blending affects only the data visualization. With data blending, you can reveal relationships across multiple datasets without altering the datasets.
For example, suppose that you want to see how sales for different product subcategories are doing relative to their targets. Here's how you create a side-by-side comparison of product subcategory totals from the SuperStoreSales and SuperStoreTarget datasets.
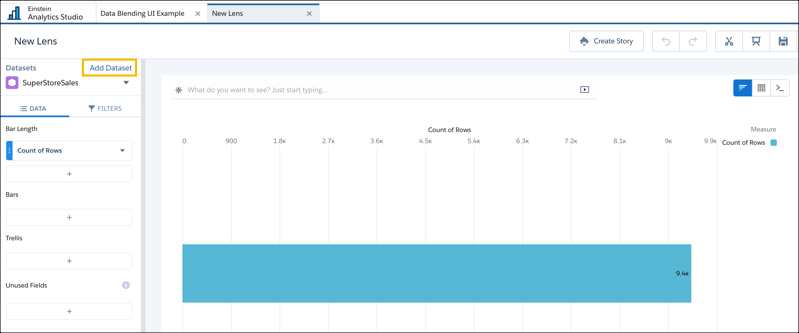
- In CRM Analytics, open a lens for the primary SuperStoreSales dataset.
-
Click Add Dataset.
-
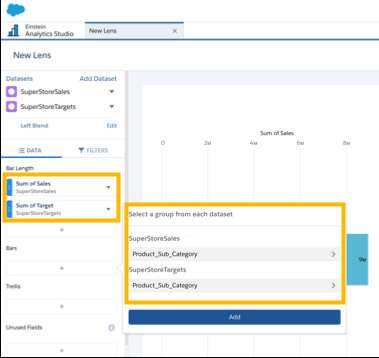
Add SuperStoreTarget as the secondary dataset.
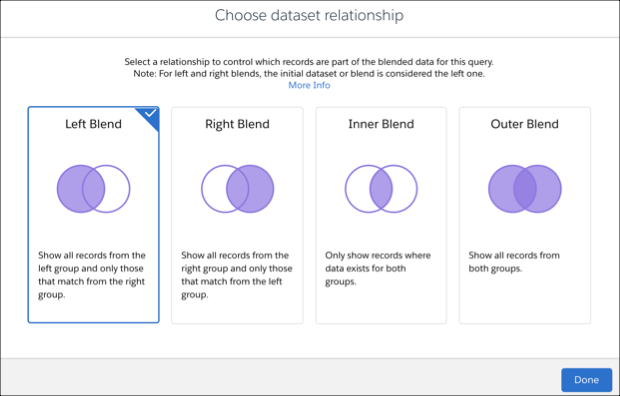
The lens now includes data from both datasets. By default, the data is combined using a left blend. All data from the primary dataset is included along with the data from the secondary dataset that matches the primary dataset.
To extend your exploration further, add more datasets. You can query up to four datasets in a single exploration.
- To change the blend type:
-
To create a meaningful side-by-side comparison, select measures and the field to group
by from each dataset.
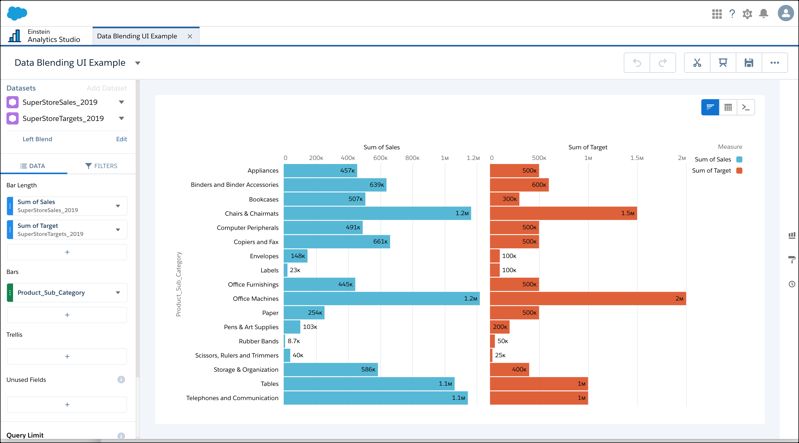
When defining groups, measures, and filters, select fields from any of the blended datasets. This example includes Sum of Sales for the SuperStoreSales dataset and Sum of Target for the SuperStoreTarget dataset. To group by product subcategories, select Product_Sub_Category for each of the datasets.
The query result shows the relationship between Sum of Sales and Sum of Target for each product subcategory.
Limitations:
- You can blend up to six datasets.
- Add all datasets before beginning to explore them. The Add Dataset control is disabled when you add groupings, measures, or filters.
- You can add a dataset only once.
- These features aren't available: drill and focus, values table, windowing and timeseries functions, totals and subtotals, and Natural Language Queries (NLQ).
- Faceting applies only to the primary dataset when you blend data from multiple datasets.
- Record-level actions work only with the primary dataset.