
You are here:
Organize and Summarize Data in a Pivot Table
To identify patterns in large amounts of data quickly, arrange the data by a key dimension in a pivot table. For deeper comparative analysis, you can group the pivoted data further and then add row and column totals, subtotals, and grand totals to the pivot table. To evaluate data in a pivot table based on ranking, sort a measure for a pivoted dimension in ascending or descending order (beta).
You can add row totals, column totals, or both to pivot tables with at least two groupings in a lens or dashboard. When you select row and column totals, the pivot table also shows the row and column grand totals. To show subtotals and to sort by a measure, add at least two groupings in addition to the pivoted dimension.
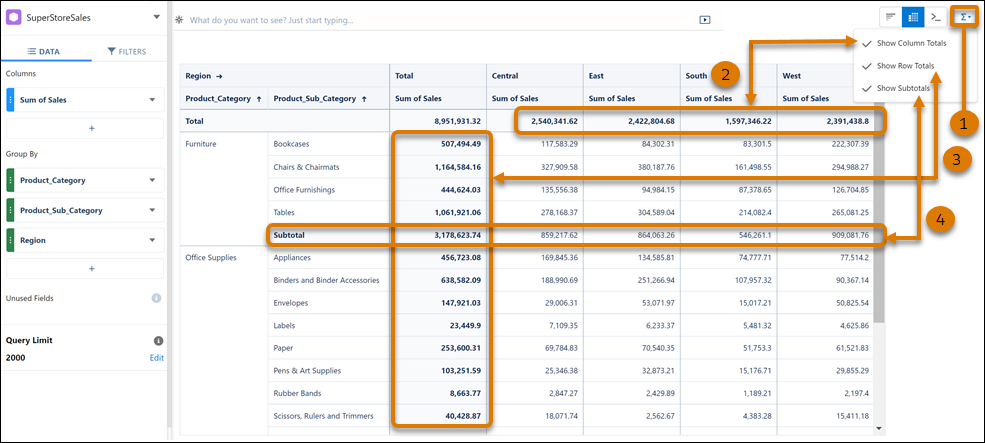
For example, your pivot table shows sales data pivoted on region and grouped by product
category and subcategories. To see total sales for each product category by region,
click  (1), and then select
Show Column Totals (2). To see sales totals for each region
across all product subcategories, select Show Row Totals (3). To
see sales subtotals by product subcategory across all regions, select Show
Subtotals (4).
(1), and then select
Show Column Totals (2). To see sales totals for each region
across all product subcategories, select Show Row Totals (3). To
see sales subtotals by product subcategory across all regions, select Show
Subtotals (4).
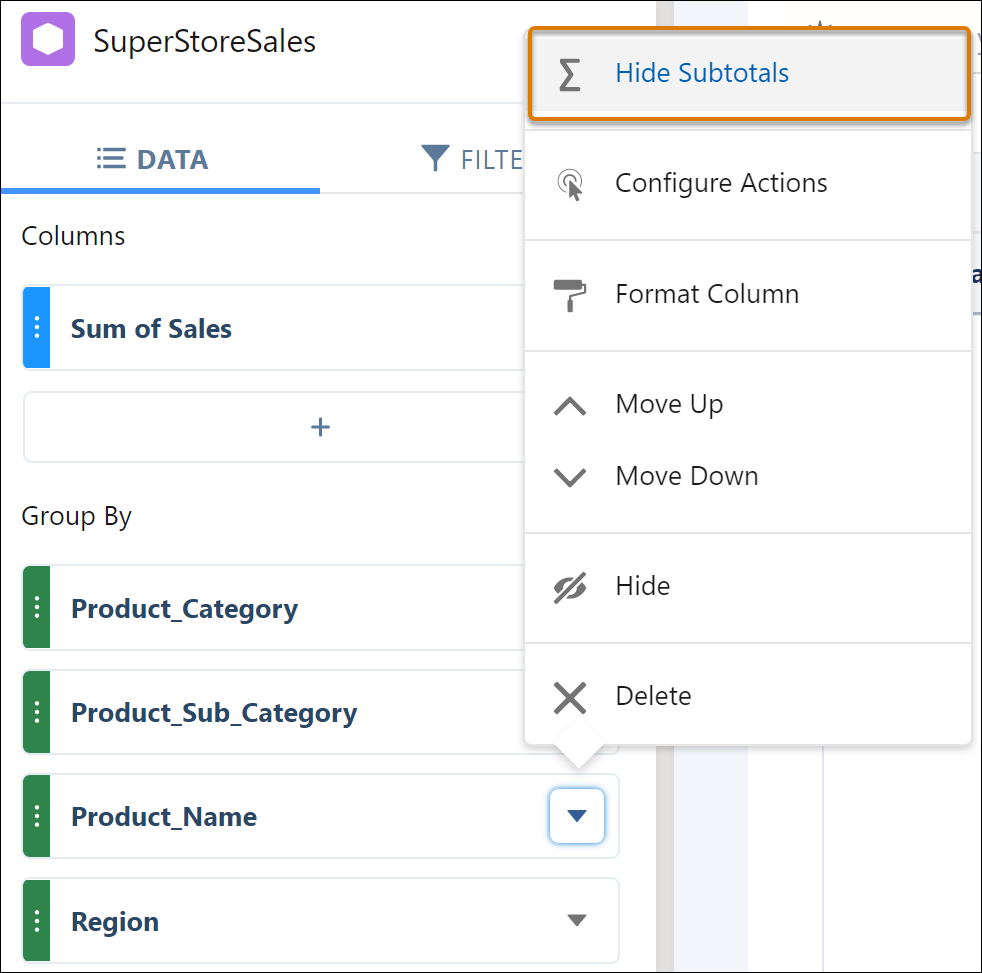
To hide the subtotal for a subgroup that you’re not interested in, select Hide Subtotals from its context menu.
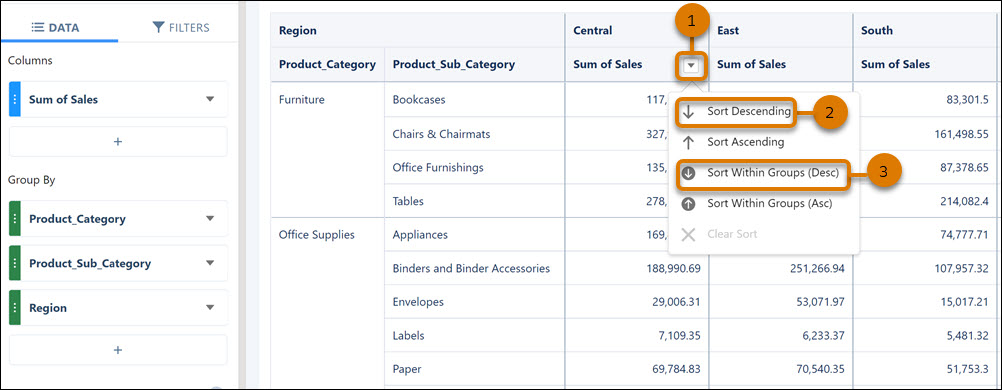
To identify the product subcategory with the highest sales for a region, sort its Sum of
Sales column. Click ![]() in the column header (1), and
then select Sort Descending (2). To find the product subcategory under furniture with
the highest sales for the region, click Sort Within Groups (Desc) (3).
in the column header (1), and
then select Sort Descending (2). To find the product subcategory under furniture with
the highest sales for the region, click Sort Within Groups (Desc) (3).
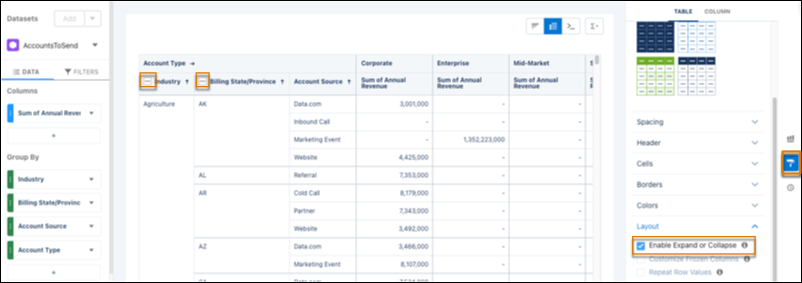
To expand and collapse groups and sub-groups in pivot tables, go to Formatting and select Enable Expand or Collapse.
Pivot Table Limitations
Keep these limitations in mind when working with pivot tables.
- When using compact form 1.0, totals and subtotals aren't supported in time zone-enabled orgs.
- To view totals in a time zone-enabled org, pivot the table on a field other than the compound date.
- Subtotals are supported when sorting within groups but not when sorting across groups.
- Row totals aren’t supported when the underlying query has an aggregate filter or window function formula.
- For accurate column totals, ensure that query limits are high enough to include all the records you want in your analysis.
- Totals and subtotals aren't supported in CRM Analytics Direct Data.